29
/
en
AIzaSyAYiBZKx7MnpbEhh9jyipgxe19OcubqV5w
April 1, 2024
73223
Australia
AUS
true
2
1
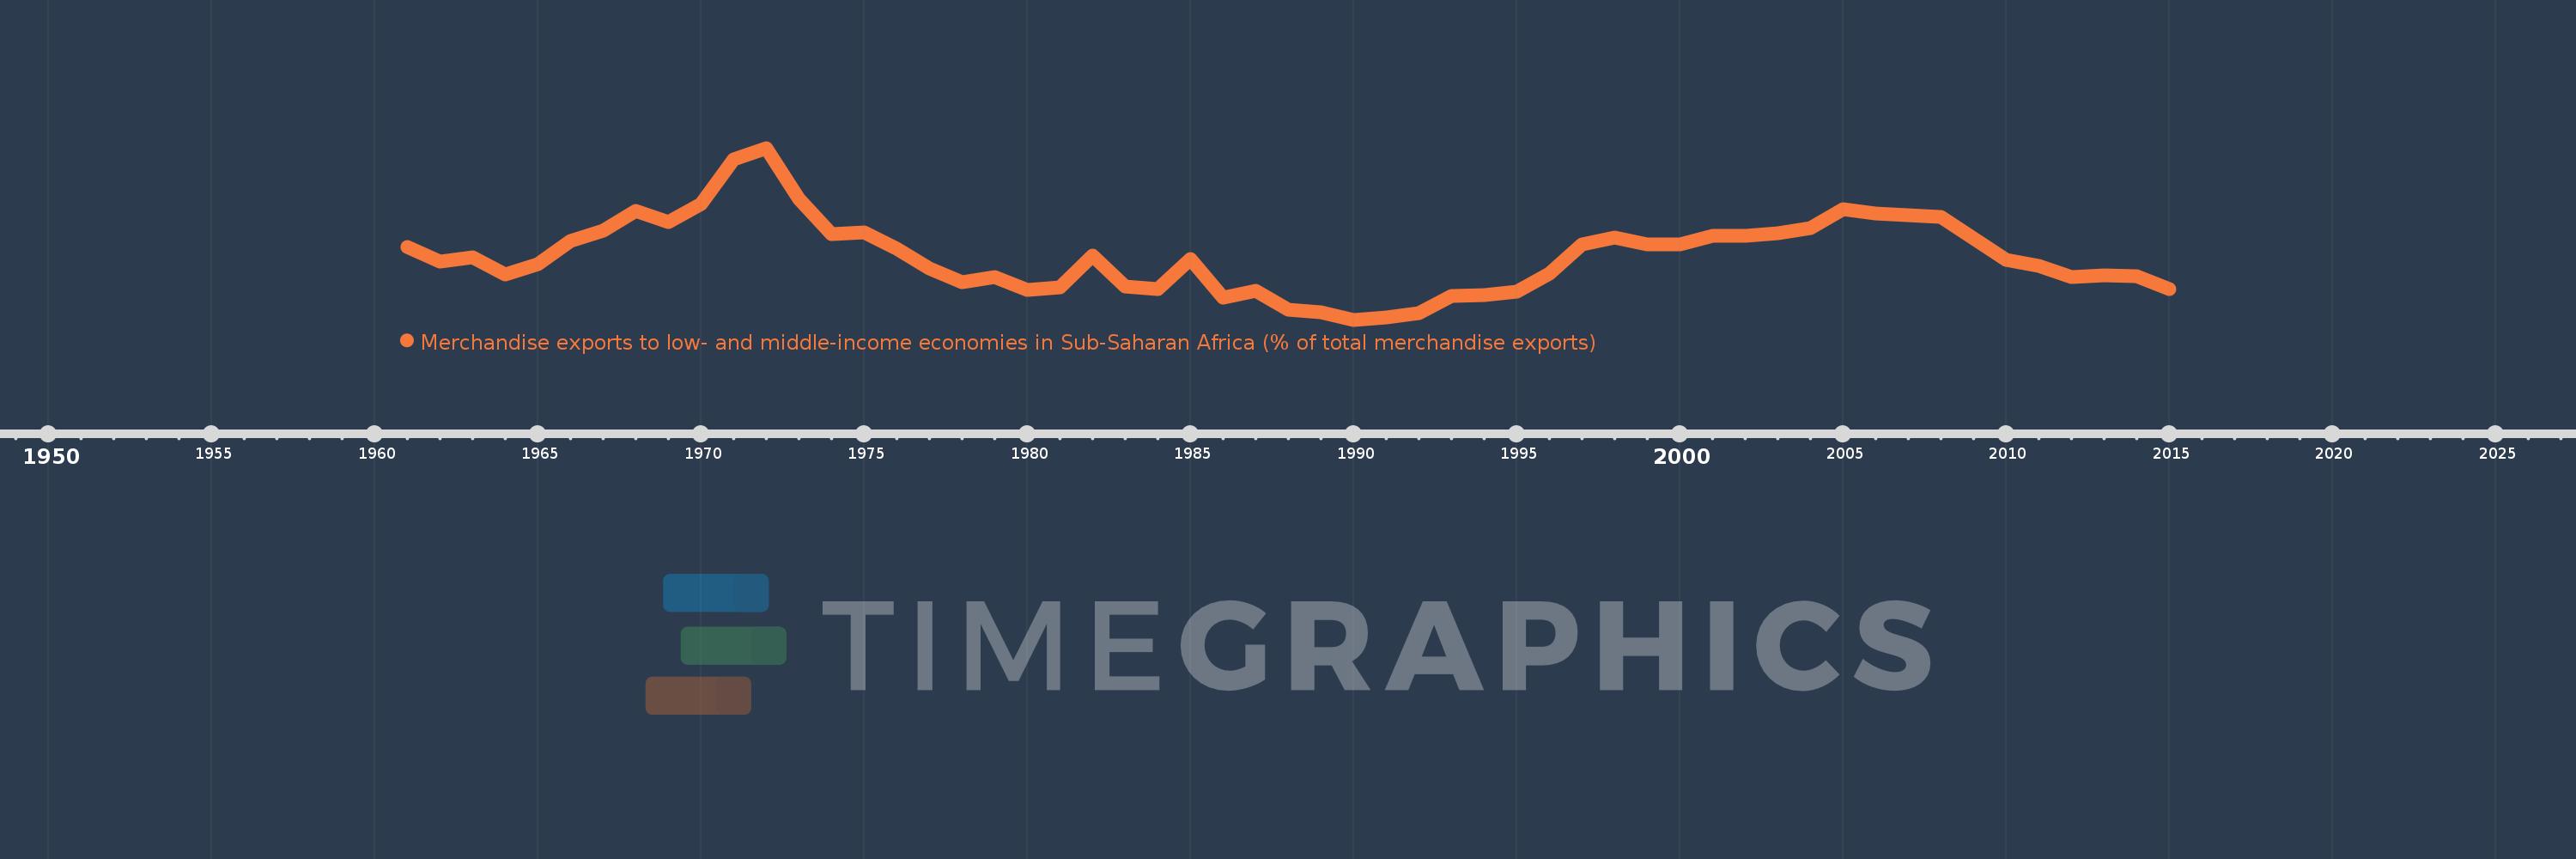
Merchandise exports to low- and middle-income economies in Sub-Saharan Africa (% of total merchandise exports)
2015,2014,2013,2012,2011,2010,2009,2008,2007,2006,2005,2004,2003,2002,2001,2000,1999,1998,1997,1996,1995,1994,1993,1992,1991,1990,1989,1988,1987,1986,1985,1984,1983,1982,1981,1980,1979,1978,1977,1976,1975,1974,1973,1972,1971,1970,1969,1968,1967,1966,1965,1964,1963,1962,1961
This statistics in other country:
AfghanistanAlbaniaAlgeriaAngolaArab WorldArgentinaArmeniaAustraliaAustriaAzerbaijanBahamas, TheBahrainBangladeshBarbadosBelarusBelgiumBelizeBeninBermudaBoliviaBrazilBulgariaBurkina FasoBurundiCabo VerdeCambodiaCameroonCanadaCaribbean small statesCentral African RepublicCentral Europe and the BalticsChadChileChinaColombiaCongo, Dem. Rep.Congo, Rep.Costa RicaCote d'IvoireCroatiaCubaCyprusCzech RepublicDenmarkDjiboutiDominicaDominican RepublicEarly-demographic dividendEast Asia & PacificEast Asia & Pacific (excluding high income)East Asia & Pacific (IDA & IBRD countries)EcuadorEgypt, Arab Rep.EstoniaEthiopiaEuro areaEurope & Central AsiaEurope & Central Asia (excluding high income)Europe & Central Asia (IDA & IBRD countries)European UnionFijiFinlandFragile and conflict affected situationsFranceGabonGambia, TheGeorgiaGermanyGhanaGibraltarGreeceGreenlandGuatemalaGuineaGuinea-BissauGuyanaHaitiHeavily indebted poor countries (HIPC)High incomeHondurasHong Kong SAR, ChinaHungaryIBRD onlyIcelandIDA & IBRD totalIDA blendIDA onlyIDA totalIndiaIndonesiaIran, Islamic Rep.IraqIrelandIsraelItalyJamaicaJapanJordanKazakhstanKenyaKorea, Dem. People’s Rep.Korea, Rep.KuwaitLao PDRLate-demographic dividendLatin America & Caribbean Latin America & Caribbean (excluding high income)Latin America & the Caribbean (IDA & IBRD countries)LatviaLeast developed countries: UN classificationLebanonLiberiaLibyaLithuaniaLow & middle incomeLow incomeLower middle incomeLuxembourgMacao SAR, ChinaMacedonia, FYRMadagascarMalawiMalaysiaMaliMaltaMauritaniaMauritiusMexicoMiddle East & North AfricaMiddle East & North Africa (excluding high income)Middle East & North Africa (IDA & IBRD countries)Middle incomeMoldovaMontenegroMoroccoMozambiqueMyanmarNetherlandsNew ZealandNicaraguaNigerNigeriaNorth AmericaNorwayOECD membersOmanOther small statesPacific island small statesPakistanPanamaPapua New GuineaParaguayPeruPhilippinesPolandPortugalPost-demographic dividendPre-demographic dividendQatarRomaniaRussian FederationRwandaSaudi ArabiaSenegalSerbiaSeychellesSierra LeoneSingaporeSlovak RepublicSloveniaSmall statesSomaliaSouth AfricaSouth AsiaSouth Asia (IDA & IBRD)SpainSri LankaSt. LuciaSt. Vincent and the GrenadinesSub-Saharan Africa Sub-Saharan Africa (excluding high income)Sub-Saharan Africa (IDA & IBRD countries)SudanSurinameSwedenSwitzerlandSyrian Arab RepublicTanzaniaThailandTogoTrinidad and TobagoTunisiaTurkeyUgandaUkraineUnited Arab EmiratesUnited KingdomUnited StatesUpper middle incomeUruguayVenezuela, RBVietnamWorldYemen, Rep.ZambiaZimbabwe Timeline:
This timeline shows a graph from 1961 to 2015 of Australia. No data until 1960. Number of actual observations by date: 55.
Source name:
World Development Indicators
Source organization:
World Bank staff estimates based data from International Monetary Fund's Direction of Trade database.
Categories, topics:
Private Sector, Trade
Last updated:
apr 23, 2017
Indicators value changes by year
At the date of observation
Value
Absolute change
Change from previous value
jan 1, 1961
1.607
+1.607
0.0%
jan 1, 1962
1.381
-0.225
-14.03%
jan 1, 1963
1.451
+0.07
5.04%
jan 1, 1964
1.175
-0.276
-19.0%
jan 1, 1965
1.337
+0.162
13.76%
jan 1, 1966
1.705
+0.368
27.51%
jan 1, 1967
1.855
+0.151
8.84%
jan 1, 1968
2.164
+0.309
16.65%
jan 1, 1969
1.988
-0.176
-8.13%
jan 1, 1970
2.277
+0.289
14.52%
jan 1, 1971
2.962
+0.685
30.08%
jan 1, 1972
3.144
+0.182
6.15%
jan 1, 1973
2.357
-0.787
-25.03%
jan 1, 1974
1.81
-0.546
-23.18%
jan 1, 1975
1.832
+0.022
1.22%
jan 1, 1976
1.579
-0.253
-13.82%
jan 1, 1977
1.276
-0.303
-19.2%
jan 1, 1978
1.06
-0.216
-16.97%
jan 1, 1979
1.142
+0.083
7.8%
jan 1, 1980
0.945
-0.197
-17.26%
jan 1, 1981
0.98
+0.035
3.67%
jan 1, 1982
1.476
+0.496
50.65%
jan 1, 1983
0.994
-0.482
-32.69%
jan 1, 1984
0.947
-0.047
-4.7%
jan 1, 1985
1.425
+0.478
50.44%
jan 1, 1986
0.815
-0.609
-42.77%
jan 1, 1987
0.928
+0.113
13.82%
jan 1, 1988
0.634
-0.294
-31.65%
jan 1, 1989
0.588
-0.046
-7.32%
jan 1, 1990
0.477
-0.111
-18.86%
jan 1, 1991
0.509
+0.032
6.81%
jan 1, 1992
0.584
+0.075
14.72%
jan 1, 1993
0.843
+0.259
44.33%
jan 1, 1994
0.865
+0.022
2.6%
jan 1, 1995
0.909
+0.044
5.08%
jan 1, 1996
1.199
+0.29
31.85%
jan 1, 1997
1.647
+0.449
37.41%
jan 1, 1998
1.747
+0.099
6.04%
jan 1, 1999
1.646
-0.101
-5.8%
jan 1, 2000
1.642
-0.003
-0.2%
jan 1, 2001
1.784
+0.141
8.6%
jan 1, 2002
1.774
-0.009
-0.52%
jan 1, 2003
1.815
+0.041
2.3%
jan 1, 2004
1.899
+0.084
4.65%
jan 1, 2005
2.197
+0.298
15.68%
jan 1, 2006
2.128
-0.069
-3.16%
jan 1, 2007
2.097
-0.031
-1.45%
jan 1, 2008
2.077
-0.02
-0.94%
jan 1, 2009
1.744
-0.334
-16.06%
jan 1, 2010
1.411
-0.333
-19.09%
jan 1, 2011
1.314
-0.097
-6.87%
jan 1, 2012
1.145
-0.169
-12.83%
jan 1, 2013
1.167
+0.021
1.86%
jan 1, 2014
1.147
-0.02
-1.68%
jan 1, 2015
0.949
-0.198
-17.27%
Ranking of countries by current statistics by years


Comments: