29
/
en
AIzaSyAYiBZKx7MnpbEhh9jyipgxe19OcubqV5w
April 1, 2024
188074
Malaysia
MYS
true
2
1
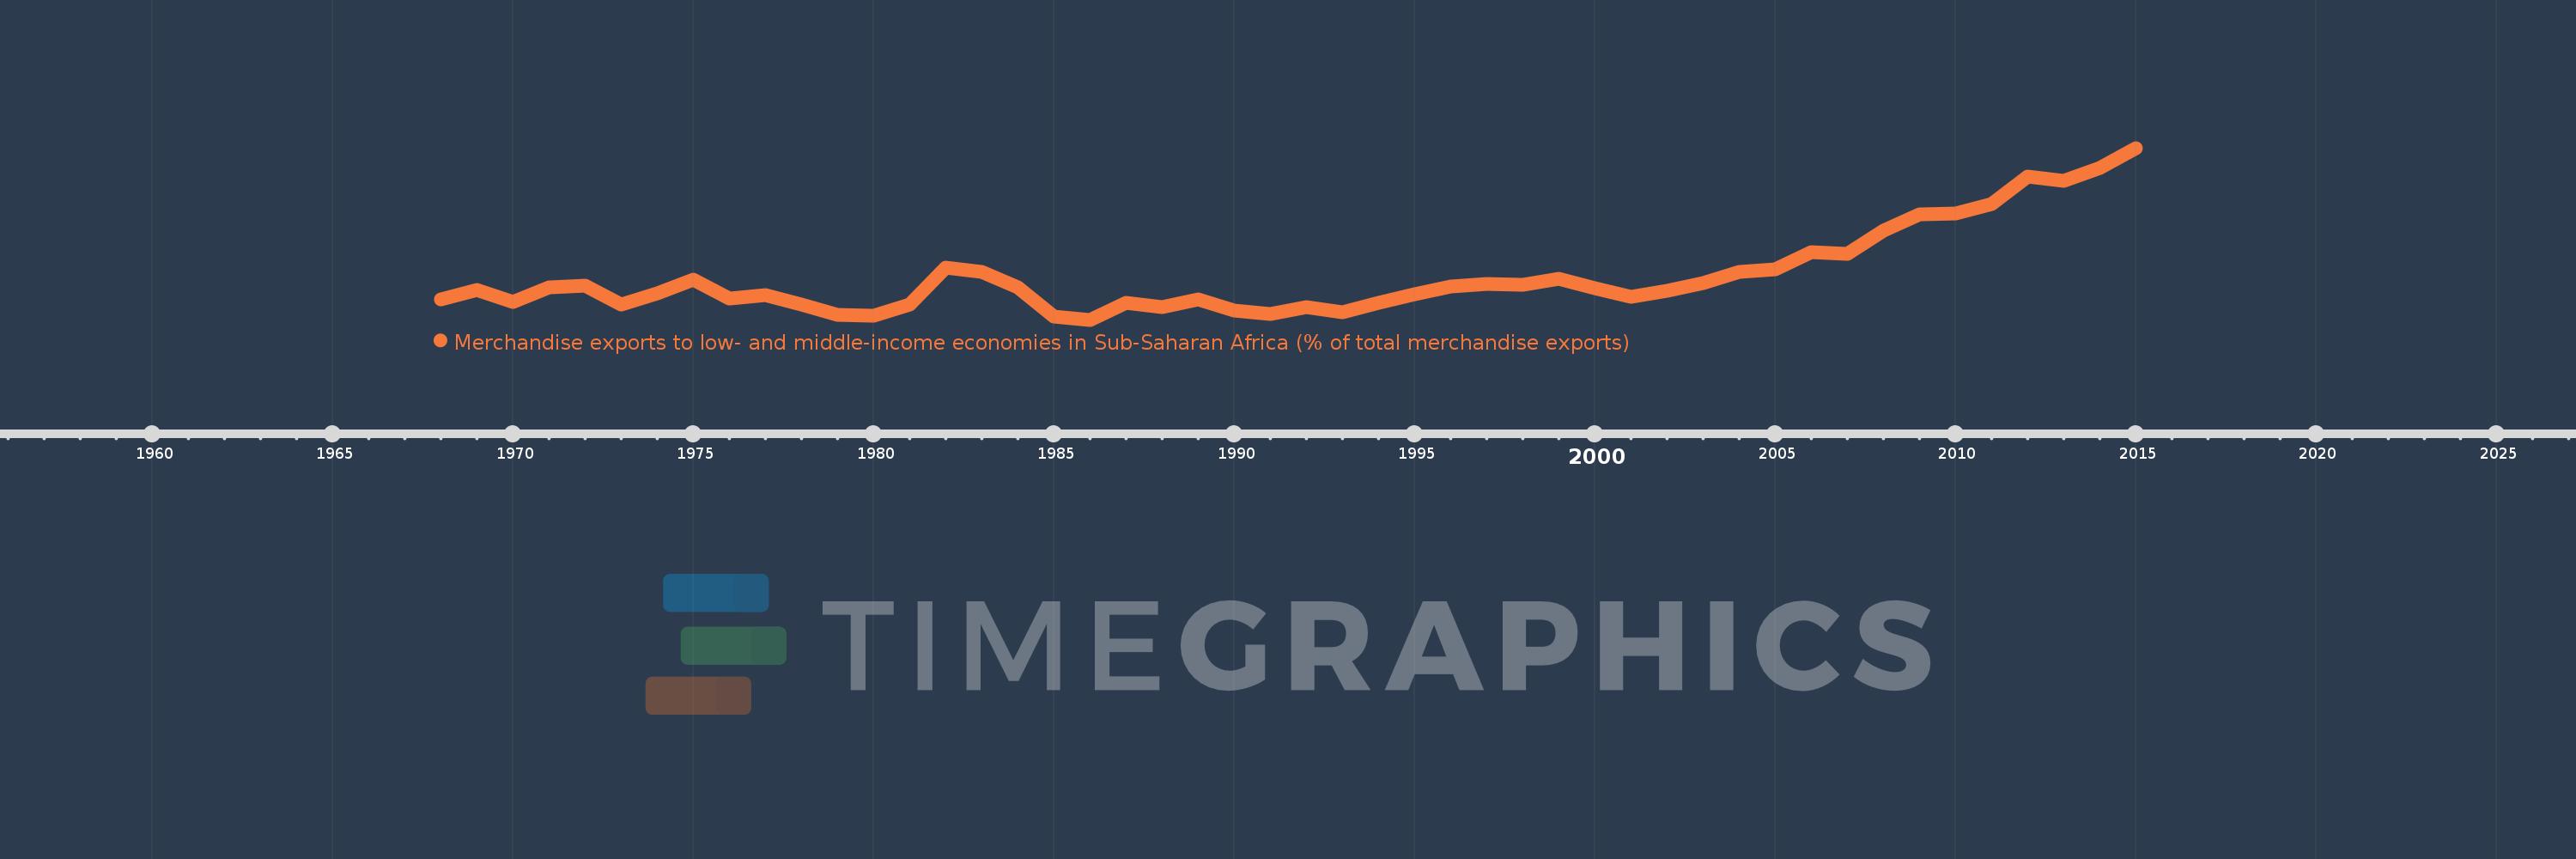
Merchandise exports to low- and middle-income economies in Sub-Saharan Africa (% of total merchandise exports)
2015,2014,2013,2012,2011,2010,2009,2008,2007,2006,2005,2004,2003,2002,2001,2000,1999,1998,1997,1996,1995,1994,1993,1992,1991,1990,1989,1988,1987,1986,1985,1984,1983,1982,1981,1980,1979,1978,1977,1976,1975,1974,1973,1972,1971,1970,1969,1968
This statistics in other country:
AfghanistanAlbaniaAlgeriaAngolaArab WorldArgentinaArmeniaAustraliaAustriaAzerbaijanBahamas, TheBahrainBangladeshBarbadosBelarusBelgiumBelizeBeninBermudaBoliviaBrazilBulgariaBurkina FasoBurundiCabo VerdeCambodiaCameroonCanadaCaribbean small statesCentral African RepublicCentral Europe and the BalticsChadChileChinaColombiaCongo, Dem. Rep.Congo, Rep.Costa RicaCote d'IvoireCroatiaCubaCyprusCzech RepublicDenmarkDjiboutiDominicaDominican RepublicEarly-demographic dividendEast Asia & PacificEast Asia & Pacific (excluding high income)East Asia & Pacific (IDA & IBRD countries)EcuadorEgypt, Arab Rep.EstoniaEthiopiaEuro areaEurope & Central AsiaEurope & Central Asia (excluding high income)Europe & Central Asia (IDA & IBRD countries)European UnionFijiFinlandFragile and conflict affected situationsFranceGabonGambia, TheGeorgiaGermanyGhanaGibraltarGreeceGreenlandGuatemalaGuineaGuinea-BissauGuyanaHaitiHeavily indebted poor countries (HIPC)High incomeHondurasHong Kong SAR, ChinaHungaryIBRD onlyIcelandIDA & IBRD totalIDA blendIDA onlyIDA totalIndiaIndonesiaIran, Islamic Rep.IraqIrelandIsraelItalyJamaicaJapanJordanKazakhstanKenyaKorea, Dem. People’s Rep.Korea, Rep.KuwaitLao PDRLate-demographic dividendLatin America & Caribbean Latin America & Caribbean (excluding high income)Latin America & the Caribbean (IDA & IBRD countries)LatviaLeast developed countries: UN classificationLebanonLiberiaLibyaLithuaniaLow & middle incomeLow incomeLower middle incomeLuxembourgMacao SAR, ChinaMacedonia, FYRMadagascarMalawiMalaysiaMaliMaltaMauritaniaMauritiusMexicoMiddle East & North AfricaMiddle East & North Africa (excluding high income)Middle East & North Africa (IDA & IBRD countries)Middle incomeMoldovaMontenegroMoroccoMozambiqueMyanmarNetherlandsNew ZealandNicaraguaNigerNigeriaNorth AmericaNorwayOECD membersOmanOther small statesPacific island small statesPakistanPanamaPapua New GuineaParaguayPeruPhilippinesPolandPortugalPost-demographic dividendPre-demographic dividendQatarRomaniaRussian FederationRwandaSaudi ArabiaSenegalSerbiaSeychellesSierra LeoneSingaporeSlovak RepublicSloveniaSmall statesSomaliaSouth AfricaSouth AsiaSouth Asia (IDA & IBRD)SpainSri LankaSt. LuciaSt. Vincent and the GrenadinesSub-Saharan Africa Sub-Saharan Africa (excluding high income)Sub-Saharan Africa (IDA & IBRD countries)SudanSurinameSwedenSwitzerlandSyrian Arab RepublicTanzaniaThailandTogoTrinidad and TobagoTunisiaTurkeyUgandaUkraineUnited Arab EmiratesUnited KingdomUnited StatesUpper middle incomeUruguayVenezuela, RBVietnamWorldYemen, Rep.ZambiaZimbabwe Timeline:
This timeline shows a graph from 1968 to 2015 of Malaysia. No data until 1967. Number of actual observations by date: 48.
Source name:
World Development Indicators
Source organization:
World Bank staff estimates based data from International Monetary Fund's Direction of Trade database.
Categories, topics:
Private Sector, Trade
Last updated:
apr 23, 2017
Indicators value changes by year
At the date of observation
Value
Absolute change
Change from previous value
jan 1, 1968
0.492
+0.492
0.0%
jan 1, 1969
0.585
+0.092
18.73%
jan 1, 1970
0.465
-0.12
-20.54%
jan 1, 1971
0.613
+0.148
31.9%
jan 1, 1972
0.633
+0.02
3.25%
jan 1, 1973
0.437
-0.196
-30.95%
jan 1, 1974
0.547
+0.11
25.11%
jan 1, 1975
0.689
+0.143
26.08%
jan 1, 1976
0.497
-0.193
-27.93%
jan 1, 1977
0.533
+0.037
7.4%
jan 1, 1978
0.433
-0.101
-18.91%
jan 1, 1979
0.325
-0.108
-24.95%
jan 1, 1980
0.317
-0.008
-2.52%
jan 1, 1981
0.438
+0.121
38.29%
jan 1, 1982
0.816
+0.378
86.33%
jan 1, 1983
0.774
-0.041
-5.08%
jan 1, 1984
0.617
-0.157
-20.25%
jan 1, 1985
0.312
-0.305
-49.41%
jan 1, 1986
0.276
-0.037
-11.74%
jan 1, 1987
0.455
+0.179
64.92%
jan 1, 1988
0.408
-0.047
-10.34%
jan 1, 1989
0.492
+0.084
20.73%
jan 1, 1990
0.368
-0.125
-25.32%
jan 1, 1991
0.336
-0.032
-8.61%
jan 1, 1992
0.407
+0.071
21.29%
jan 1, 1993
0.357
-0.051
-12.48%
jan 1, 1994
0.449
+0.092
25.83%
jan 1, 1995
0.538
+0.089
19.85%
jan 1, 1996
0.619
+0.081
15.05%
jan 1, 1997
0.647
+0.028
4.54%
jan 1, 1998
0.641
-0.006
-0.86%
jan 1, 1999
0.7
+0.059
9.15%
jan 1, 2000
0.6
-0.1
-14.28%
jan 1, 2001
0.514
-0.086
-14.27%
jan 1, 2002
0.573
+0.059
11.42%
jan 1, 2003
0.66
+0.087
15.22%
jan 1, 2004
0.773
+0.113
17.13%
jan 1, 2005
0.801
+0.028
3.56%
jan 1, 2006
0.979
+0.178
22.23%
jan 1, 2007
0.96
-0.019
-1.94%
jan 1, 2008
1.205
+0.245
25.52%
jan 1, 2009
1.369
+0.164
13.62%
jan 1, 2010
1.378
+0.009
0.65%
jan 1, 2011
1.483
+0.106
7.67%
jan 1, 2012
1.764
+0.281
18.93%
jan 1, 2013
1.719
-0.046
-2.59%
jan 1, 2014
1.859
+0.14
8.17%
jan 1, 2015
2.063
+0.204
10.99%
Ranking of countries by current statistics by years


Comments: