29
/
en
AIzaSyAYiBZKx7MnpbEhh9jyipgxe19OcubqV5w
April 1, 2024
54983
Post-demographic dividend
PST
false
2
1
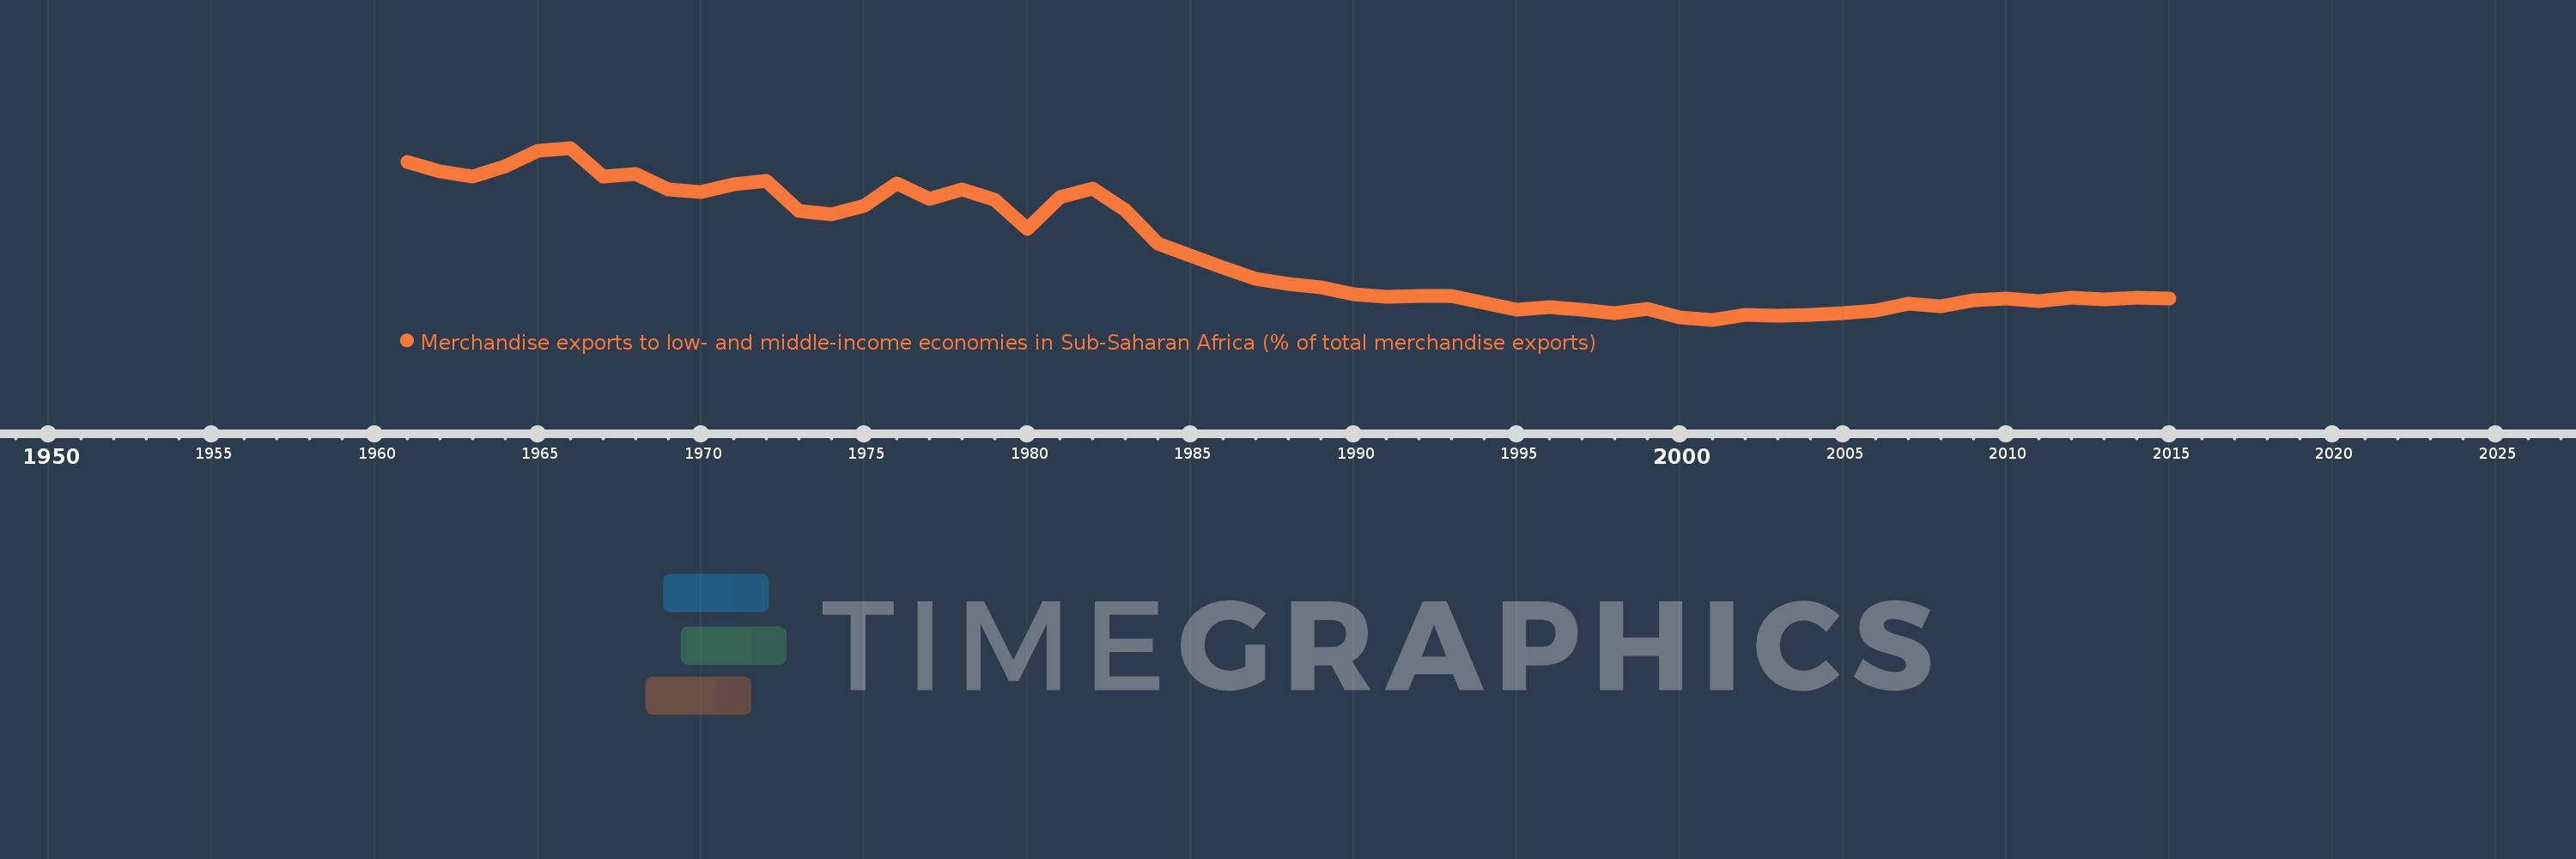
Merchandise exports to low- and middle-income economies in Sub-Saharan Africa (% of total merchandise exports)
2015,2014,2013,2012,2011,2010,2009,2008,2007,2006,2005,2004,2003,2002,2001,2000,1999,1998,1997,1996,1995,1994,1993,1992,1991,1990,1989,1988,1987,1986,1985,1984,1983,1982,1981,1980,1979,1978,1977,1976,1975,1974,1973,1972,1971,1970,1969,1968,1967,1966,1965,1964,1963,1962,1961
This statistics in other country:
AfghanistanAlbaniaAlgeriaAngolaArab WorldArgentinaArmeniaAustraliaAustriaAzerbaijanBahamas, TheBahrainBangladeshBarbadosBelarusBelgiumBelizeBeninBermudaBoliviaBrazilBulgariaBurkina FasoBurundiCabo VerdeCambodiaCameroonCanadaCaribbean small statesCentral African RepublicCentral Europe and the BalticsChadChileChinaColombiaCongo, Dem. Rep.Congo, Rep.Costa RicaCote d'IvoireCroatiaCubaCyprusCzech RepublicDenmarkDjiboutiDominicaDominican RepublicEarly-demographic dividendEast Asia & PacificEast Asia & Pacific (excluding high income)East Asia & Pacific (IDA & IBRD countries)EcuadorEgypt, Arab Rep.EstoniaEthiopiaEuro areaEurope & Central AsiaEurope & Central Asia (excluding high income)Europe & Central Asia (IDA & IBRD countries)European UnionFijiFinlandFragile and conflict affected situationsFranceGabonGambia, TheGeorgiaGermanyGhanaGibraltarGreeceGreenlandGuatemalaGuineaGuinea-BissauGuyanaHaitiHeavily indebted poor countries (HIPC)High incomeHondurasHong Kong SAR, ChinaHungaryIBRD onlyIcelandIDA & IBRD totalIDA blendIDA onlyIDA totalIndiaIndonesiaIran, Islamic Rep.IraqIrelandIsraelItalyJamaicaJapanJordanKazakhstanKenyaKorea, Dem. People’s Rep.Korea, Rep.KuwaitLao PDRLate-demographic dividendLatin America & Caribbean Latin America & Caribbean (excluding high income)Latin America & the Caribbean (IDA & IBRD countries)LatviaLeast developed countries: UN classificationLebanonLiberiaLibyaLithuaniaLow & middle incomeLow incomeLower middle incomeLuxembourgMacao SAR, ChinaMacedonia, FYRMadagascarMalawiMalaysiaMaliMaltaMauritaniaMauritiusMexicoMiddle East & North AfricaMiddle East & North Africa (excluding high income)Middle East & North Africa (IDA & IBRD countries)Middle incomeMoldovaMontenegroMoroccoMozambiqueMyanmarNetherlandsNew ZealandNicaraguaNigerNigeriaNorth AmericaNorwayOECD membersOmanOther small statesPacific island small statesPakistanPanamaPapua New GuineaParaguayPeruPhilippinesPolandPortugalPost-demographic dividendPre-demographic dividendQatarRomaniaRussian FederationRwandaSaudi ArabiaSenegalSerbiaSeychellesSierra LeoneSingaporeSlovak RepublicSloveniaSmall statesSomaliaSouth AfricaSouth AsiaSouth Asia (IDA & IBRD)SpainSri LankaSt. LuciaSt. Vincent and the GrenadinesSub-Saharan Africa Sub-Saharan Africa (excluding high income)Sub-Saharan Africa (IDA & IBRD countries)SudanSurinameSwedenSwitzerlandSyrian Arab RepublicTanzaniaThailandTogoTrinidad and TobagoTunisiaTurkeyUgandaUkraineUnited Arab EmiratesUnited KingdomUnited StatesUpper middle incomeUruguayVenezuela, RBVietnamWorldYemen, Rep.ZambiaZimbabwe Timeline:
This timeline shows a graph from 1961 to 2015 of Post-demographic dividend. No data until 1960. Number of actual observations by date: 55.
Source name:
World Development Indicators
Source organization:
World Bank staff estimates based data from International Monetary Fund's Direction of Trade database.
Categories, topics:
Private Sector, Trade
Last updated:
apr 23, 2017
Indicators value changes by year
At the date of observation
Value
Absolute change
Change from previous value
jan 1, 1961
4.163
+4.163
0.0%
jan 1, 1962
3.98
-0.183
-4.41%
jan 1, 1963
3.871
-0.109
-2.75%
jan 1, 1964
4.082
+0.211
5.46%
jan 1, 1965
4.385
+0.303
7.44%
jan 1, 1966
4.44
+0.054
1.24%
jan 1, 1967
3.868
-0.571
-12.87%
jan 1, 1968
3.925
+0.057
1.47%
jan 1, 1969
3.624
-0.301
-7.67%
jan 1, 1970
3.562
-0.062
-1.7%
jan 1, 1971
3.712
+0.15
4.21%
jan 1, 1972
3.795
+0.082
2.22%
jan 1, 1973
3.188
-0.607
-16.0%
jan 1, 1974
3.125
-0.063
-1.97%
jan 1, 1975
3.296
+0.171
5.49%
jan 1, 1976
3.742
+0.445
13.51%
jan 1, 1977
3.436
-0.306
-8.17%
jan 1, 1978
3.612
+0.176
5.11%
jan 1, 1979
3.42
-0.191
-5.3%
jan 1, 1980
2.836
-0.584
-17.09%
jan 1, 1981
3.473
+0.637
22.46%
jan 1, 1982
3.632
+0.16
4.6%
jan 1, 1983
3.217
-0.416
-11.44%
jan 1, 1984
2.55
-0.667
-20.72%
jan 1, 1985
2.3
-0.251
-9.83%
jan 1, 1986
2.074
-0.225
-9.8%
jan 1, 1987
1.855
-0.22
-10.58%
jan 1, 1988
1.751
-0.104
-5.59%
jan 1, 1989
1.672
-0.079
-4.5%
jan 1, 1990
1.54
-0.133
-7.93%
jan 1, 1991
1.487
-0.053
-3.44%
jan 1, 1992
1.509
+0.023
1.52%
jan 1, 1993
1.507
-0.003
-0.18%
jan 1, 1994
1.371
-0.135
-8.99%
jan 1, 1995
1.235
-0.137
-9.97%
jan 1, 1996
1.283
+0.049
3.93%
jan 1, 1997
1.239
-0.045
-3.47%
jan 1, 1998
1.164
-0.074
-5.99%
jan 1, 1999
1.245
+0.081
6.97%
jan 1, 2000
1.077
-0.168
-13.49%
jan 1, 2001
1.037
-0.04
-3.75%
jan 1, 2002
1.126
+0.089
8.57%
jan 1, 2003
1.11
-0.016
-1.45%
jan 1, 2004
1.131
+0.021
1.9%
jan 1, 2005
1.17
+0.039
3.47%
jan 1, 2006
1.215
+0.045
3.84%
jan 1, 2007
1.35
+0.135
11.15%
jan 1, 2008
1.311
-0.04
-2.94%
jan 1, 2009
1.417
+0.106
8.12%
jan 1, 2010
1.462
+0.045
3.2%
jan 1, 2011
1.405
-0.057
-3.92%
jan 1, 2012
1.468
+0.063
4.5%
jan 1, 2013
1.444
-0.024
-1.65%
jan 1, 2014
1.468
+0.023
1.62%
jan 1, 2015
1.452
-0.015
-1.03%
Ranking of countries by current statistics by years


Comments: