29
/
en
AIzaSyAYiBZKx7MnpbEhh9jyipgxe19OcubqV5w
April 1, 2024
38345
IDA blend
IDB
false
2
1
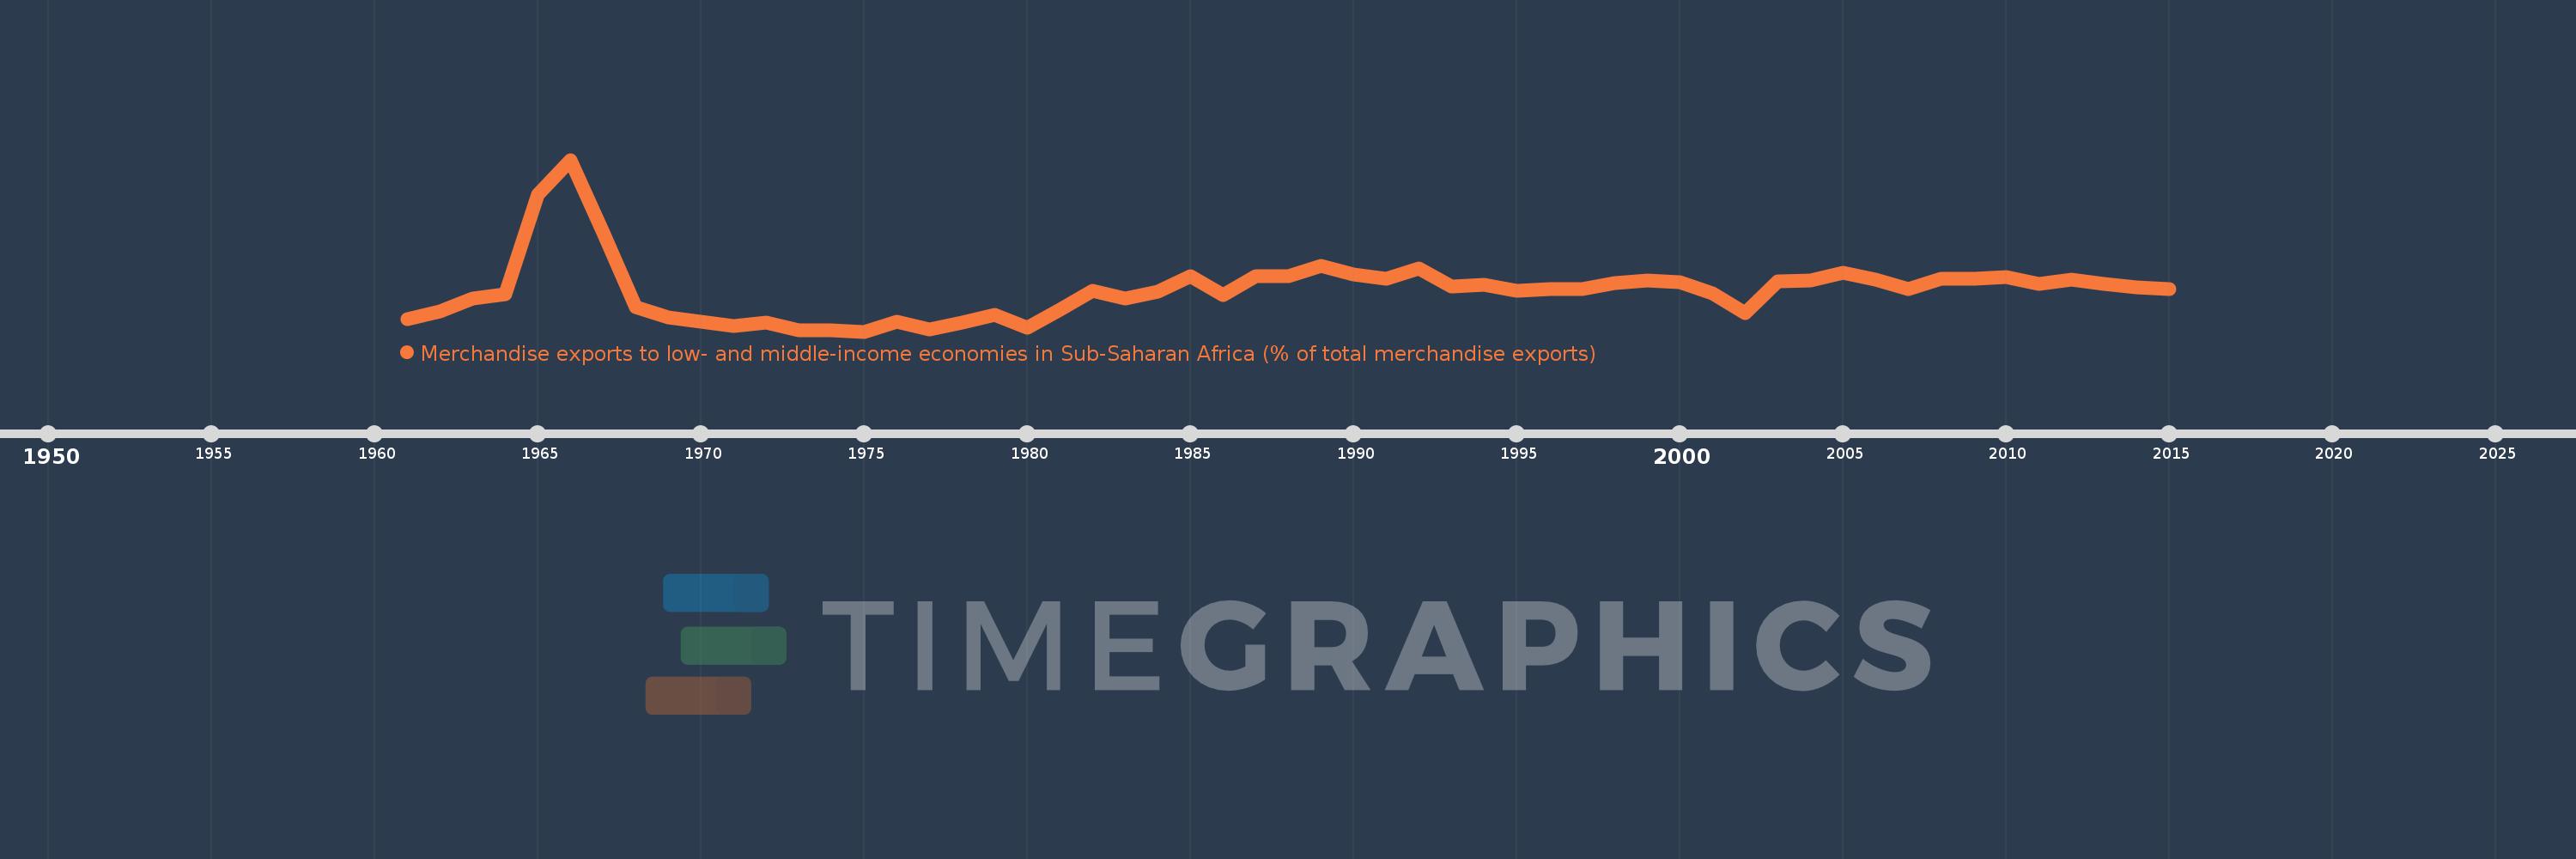
Merchandise exports to low- and middle-income economies in Sub-Saharan Africa (% of total merchandise exports)
2015,2014,2013,2012,2011,2010,2009,2008,2007,2006,2005,2004,2003,2002,2001,2000,1999,1998,1997,1996,1995,1994,1993,1992,1991,1990,1989,1988,1987,1986,1985,1984,1983,1982,1981,1980,1979,1978,1977,1976,1975,1974,1973,1972,1971,1970,1969,1968,1967,1966,1965,1964,1963,1962,1961
This statistics in other country:
AfghanistanAlbaniaAlgeriaAngolaArab WorldArgentinaArmeniaAustraliaAustriaAzerbaijanBahamas, TheBahrainBangladeshBarbadosBelarusBelgiumBelizeBeninBermudaBoliviaBrazilBulgariaBurkina FasoBurundiCabo VerdeCambodiaCameroonCanadaCaribbean small statesCentral African RepublicCentral Europe and the BalticsChadChileChinaColombiaCongo, Dem. Rep.Congo, Rep.Costa RicaCote d'IvoireCroatiaCubaCyprusCzech RepublicDenmarkDjiboutiDominicaDominican RepublicEarly-demographic dividendEast Asia & PacificEast Asia & Pacific (excluding high income)East Asia & Pacific (IDA & IBRD countries)EcuadorEgypt, Arab Rep.EstoniaEthiopiaEuro areaEurope & Central AsiaEurope & Central Asia (excluding high income)Europe & Central Asia (IDA & IBRD countries)European UnionFijiFinlandFragile and conflict affected situationsFranceGabonGambia, TheGeorgiaGermanyGhanaGibraltarGreeceGreenlandGuatemalaGuineaGuinea-BissauGuyanaHaitiHeavily indebted poor countries (HIPC)High incomeHondurasHong Kong SAR, ChinaHungaryIBRD onlyIcelandIDA & IBRD totalIDA blendIDA onlyIDA totalIndiaIndonesiaIran, Islamic Rep.IraqIrelandIsraelItalyJamaicaJapanJordanKazakhstanKenyaKorea, Dem. People’s Rep.Korea, Rep.KuwaitLao PDRLate-demographic dividendLatin America & Caribbean Latin America & Caribbean (excluding high income)Latin America & the Caribbean (IDA & IBRD countries)LatviaLeast developed countries: UN classificationLebanonLiberiaLibyaLithuaniaLow & middle incomeLow incomeLower middle incomeLuxembourgMacao SAR, ChinaMacedonia, FYRMadagascarMalawiMalaysiaMaliMaltaMauritaniaMauritiusMexicoMiddle East & North AfricaMiddle East & North Africa (excluding high income)Middle East & North Africa (IDA & IBRD countries)Middle incomeMoldovaMontenegroMoroccoMozambiqueMyanmarNetherlandsNew ZealandNicaraguaNigerNigeriaNorth AmericaNorwayOECD membersOmanOther small statesPacific island small statesPakistanPanamaPapua New GuineaParaguayPeruPhilippinesPolandPortugalPost-demographic dividendPre-demographic dividendQatarRomaniaRussian FederationRwandaSaudi ArabiaSenegalSerbiaSeychellesSierra LeoneSingaporeSlovak RepublicSloveniaSmall statesSomaliaSouth AfricaSouth AsiaSouth Asia (IDA & IBRD)SpainSri LankaSt. LuciaSt. Vincent and the GrenadinesSub-Saharan Africa Sub-Saharan Africa (excluding high income)Sub-Saharan Africa (IDA & IBRD countries)SudanSurinameSwedenSwitzerlandSyrian Arab RepublicTanzaniaThailandTogoTrinidad and TobagoTunisiaTurkeyUgandaUkraineUnited Arab EmiratesUnited KingdomUnited StatesUpper middle incomeUruguayVenezuela, RBVietnamWorldYemen, Rep.ZambiaZimbabwe Timeline:
This timeline shows a graph from 1961 to 2015 of IDA blend. No data until 1960. Number of actual observations by date: 55.
Source name:
World Development Indicators
Source organization:
World Bank staff estimates based data from International Monetary Fund's Direction of Trade database.
Categories, topics:
Private Sector, Trade
Last updated:
apr 23, 2017
Indicators value changes by year
Maximum:
11.758
jan 1, 1966
At the date of observation
Value
Absolute change
Change from previous value
jan 1, 1961
2.89
+2.89
0.0%
jan 1, 1962
3.284
+0.394
13.65%
jan 1, 1963
4.009
+0.725
22.09%
jan 1, 1964
4.244
+0.235
5.85%
jan 1, 1965
9.841
+5.597
131.88%
jan 1, 1966
11.758
+1.917
19.48%
jan 1, 1967
7.714
-4.044
-34.4%
jan 1, 1968
3.557
-4.157
-53.89%
jan 1, 1969
2.966
-0.59
-16.6%
jan 1, 1970
2.717
-0.249
-8.4%
jan 1, 1971
2.488
-0.229
-8.44%
jan 1, 1972
2.674
+0.187
7.5%
jan 1, 1973
2.228
-0.447
-16.7%
jan 1, 1974
2.229
+0.001
0.04%
jan 1, 1975
2.177
-0.051
-2.31%
jan 1, 1976
2.719
+0.541
24.86%
jan 1, 1977
2.309
-0.409
-15.05%
jan 1, 1978
2.669
+0.36
15.58%
jan 1, 1979
3.099
+0.43
16.11%
jan 1, 1980
2.377
-0.722
-23.3%
jan 1, 1981
3.375
+0.998
42.0%
jan 1, 1982
4.449
+1.073
31.8%
jan 1, 1983
4.025
-0.424
-9.53%
jan 1, 1984
4.399
+0.374
9.3%
jan 1, 1985
5.265
+0.866
19.69%
jan 1, 1986
4.205
-1.06
-20.14%
jan 1, 1987
5.263
+1.058
25.15%
jan 1, 1988
5.276
+0.014
0.26%
jan 1, 1989
5.861
+0.585
11.08%
jan 1, 1990
5.379
-0.481
-8.21%
jan 1, 1991
5.127
-0.253
-4.7%
jan 1, 1992
5.677
+0.55
10.73%
jan 1, 1993
4.679
-0.997
-17.57%
jan 1, 1994
4.783
+0.103
2.21%
jan 1, 1995
4.443
-0.339
-7.09%
jan 1, 1996
4.57
+0.127
2.85%
jan 1, 1997
4.536
-0.034
-0.74%
jan 1, 1998
4.86
+0.324
7.14%
jan 1, 1999
5.021
+0.161
3.31%
jan 1, 2000
4.947
-0.074
-1.48%
jan 1, 2001
4.325
-0.622
-12.56%
jan 1, 2002
3.23
-1.095
-25.33%
jan 1, 2003
4.959
+1.73
53.55%
jan 1, 2004
5.017
+0.058
1.17%
jan 1, 2005
5.436
+0.419
8.34%
jan 1, 2006
5.088
-0.347
-6.39%
jan 1, 2007
4.544
-0.545
-10.7%
jan 1, 2008
5.113
+0.569
12.52%
jan 1, 2009
5.109
-0.004
-0.07%
jan 1, 2010
5.216
+0.107
2.1%
jan 1, 2011
4.833
-0.384
-7.35%
jan 1, 2012
5.098
+0.265
5.49%
jan 1, 2013
4.847
-0.251
-4.91%
jan 1, 2014
4.639
-0.208
-4.3%
jan 1, 2015
4.561
-0.078
-1.68%
Ranking of countries by current statistics by years


Comments: