29
/
en
AIzaSyAYiBZKx7MnpbEhh9jyipgxe19OcubqV5w
April 1, 2024
25902
Central Europe and the Baltics
CEB
false
2
1
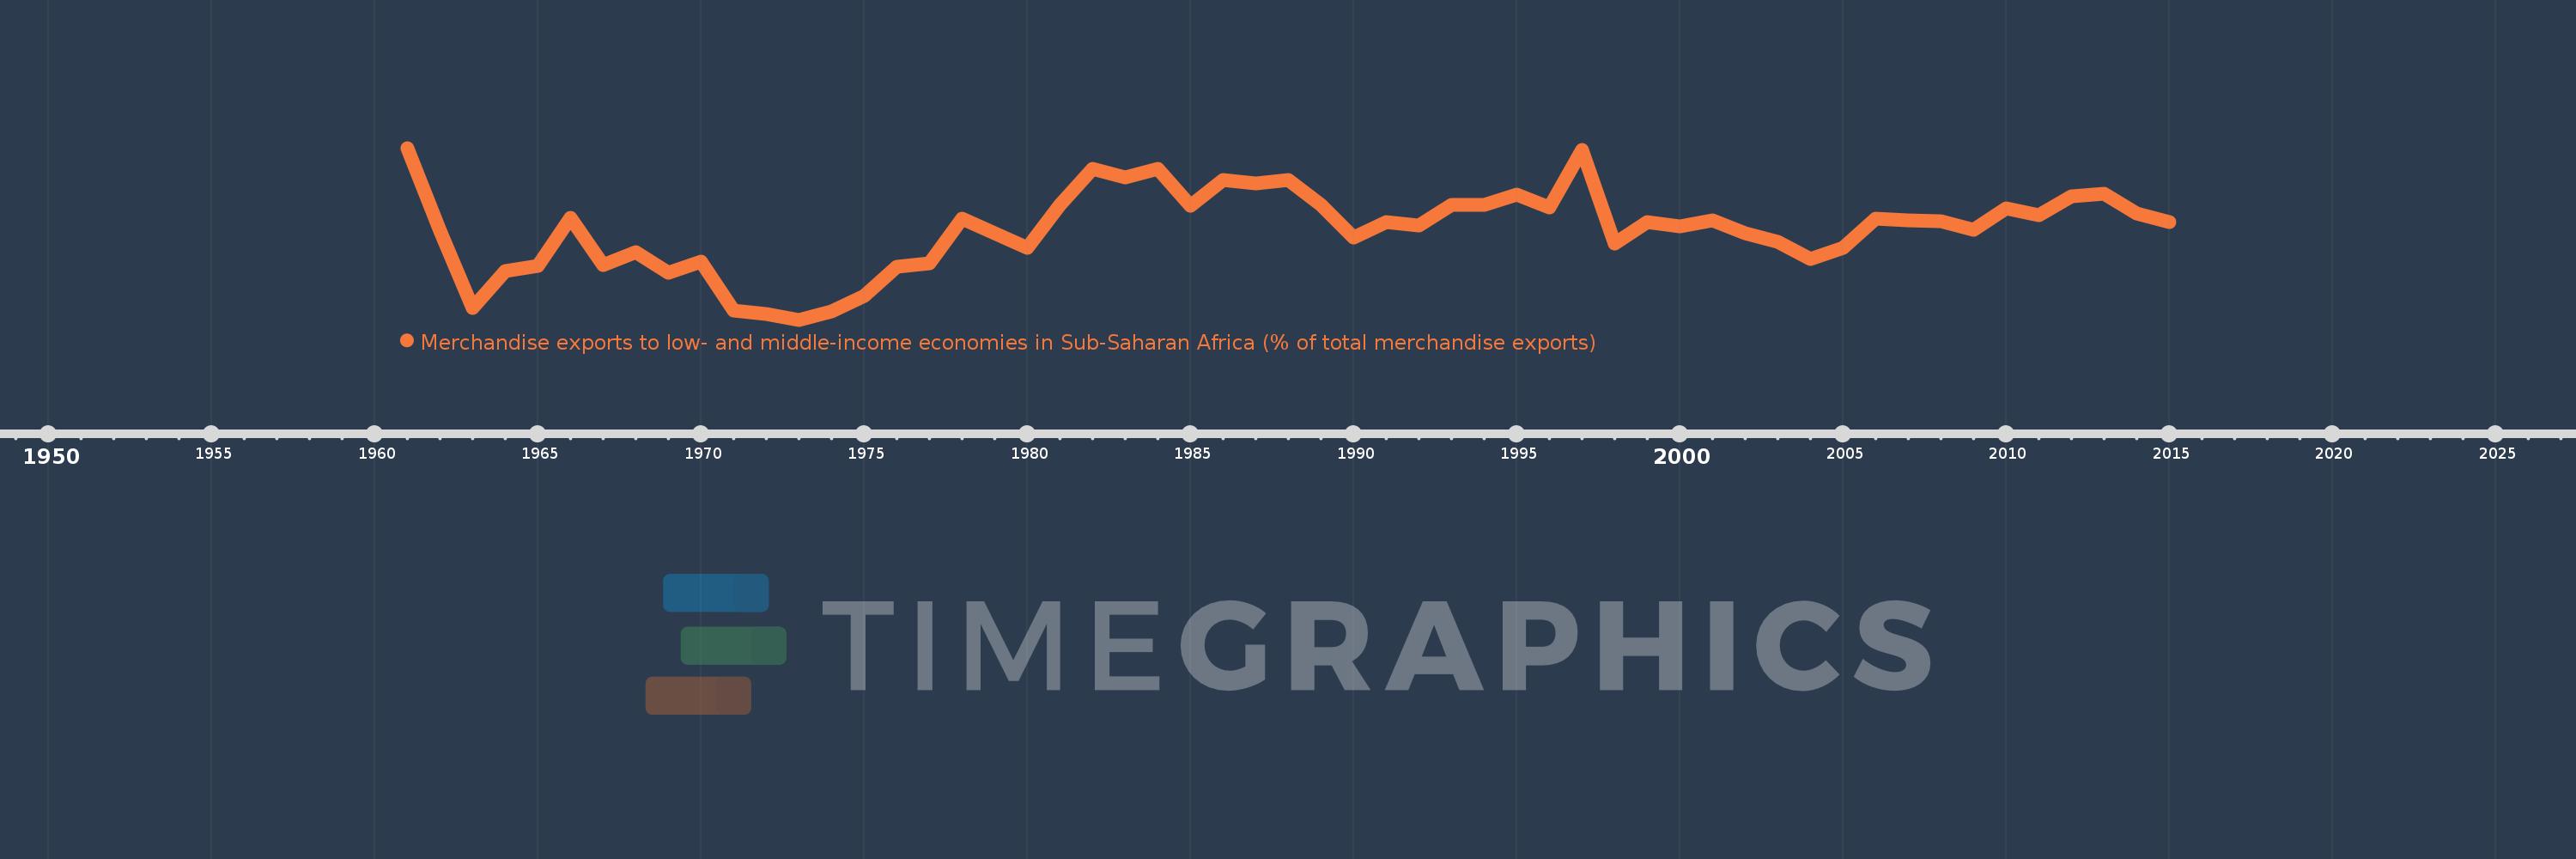
Merchandise exports to low- and middle-income economies in Sub-Saharan Africa (% of total merchandise exports)
2015,2014,2013,2012,2011,2010,2009,2008,2007,2006,2005,2004,2003,2002,2001,2000,1999,1998,1997,1996,1995,1994,1993,1992,1991,1990,1989,1988,1987,1986,1985,1984,1983,1982,1981,1980,1979,1978,1977,1976,1975,1974,1973,1972,1971,1970,1969,1968,1967,1966,1965,1964,1963,1962,1961
This statistics in other country:
AfghanistanAlbaniaAlgeriaAngolaArab WorldArgentinaArmeniaAustraliaAustriaAzerbaijanBahamas, TheBahrainBangladeshBarbadosBelarusBelgiumBelizeBeninBermudaBoliviaBrazilBulgariaBurkina FasoBurundiCabo VerdeCambodiaCameroonCanadaCaribbean small statesCentral African RepublicCentral Europe and the BalticsChadChileChinaColombiaCongo, Dem. Rep.Congo, Rep.Costa RicaCote d'IvoireCroatiaCubaCyprusCzech RepublicDenmarkDjiboutiDominicaDominican RepublicEarly-demographic dividendEast Asia & PacificEast Asia & Pacific (excluding high income)East Asia & Pacific (IDA & IBRD countries)EcuadorEgypt, Arab Rep.EstoniaEthiopiaEuro areaEurope & Central AsiaEurope & Central Asia (excluding high income)Europe & Central Asia (IDA & IBRD countries)European UnionFijiFinlandFragile and conflict affected situationsFranceGabonGambia, TheGeorgiaGermanyGhanaGibraltarGreeceGreenlandGuatemalaGuineaGuinea-BissauGuyanaHaitiHeavily indebted poor countries (HIPC)High incomeHondurasHong Kong SAR, ChinaHungaryIBRD onlyIcelandIDA & IBRD totalIDA blendIDA onlyIDA totalIndiaIndonesiaIran, Islamic Rep.IraqIrelandIsraelItalyJamaicaJapanJordanKazakhstanKenyaKorea, Dem. People’s Rep.Korea, Rep.KuwaitLao PDRLate-demographic dividendLatin America & Caribbean Latin America & Caribbean (excluding high income)Latin America & the Caribbean (IDA & IBRD countries)LatviaLeast developed countries: UN classificationLebanonLiberiaLibyaLithuaniaLow & middle incomeLow incomeLower middle incomeLuxembourgMacao SAR, ChinaMacedonia, FYRMadagascarMalawiMalaysiaMaliMaltaMauritaniaMauritiusMexicoMiddle East & North AfricaMiddle East & North Africa (excluding high income)Middle East & North Africa (IDA & IBRD countries)Middle incomeMoldovaMontenegroMoroccoMozambiqueMyanmarNetherlandsNew ZealandNicaraguaNigerNigeriaNorth AmericaNorwayOECD membersOmanOther small statesPacific island small statesPakistanPanamaPapua New GuineaParaguayPeruPhilippinesPolandPortugalPost-demographic dividendPre-demographic dividendQatarRomaniaRussian FederationRwandaSaudi ArabiaSenegalSerbiaSeychellesSierra LeoneSingaporeSlovak RepublicSloveniaSmall statesSomaliaSouth AfricaSouth AsiaSouth Asia (IDA & IBRD)SpainSri LankaSt. LuciaSt. Vincent and the GrenadinesSub-Saharan Africa Sub-Saharan Africa (excluding high income)Sub-Saharan Africa (IDA & IBRD countries)SudanSurinameSwedenSwitzerlandSyrian Arab RepublicTanzaniaThailandTogoTrinidad and TobagoTunisiaTurkeyUgandaUkraineUnited Arab EmiratesUnited KingdomUnited StatesUpper middle incomeUruguayVenezuela, RBVietnamWorldYemen, Rep.ZambiaZimbabwe Timeline:
This timeline shows a graph from 1961 to 2015 of Central Europe and the Baltics. No data until 1960. Number of actual observations by date: 55.
Source name:
World Development Indicators
Source organization:
World Bank staff estimates based data from International Monetary Fund's Direction of Trade database.
Categories, topics:
Private Sector, Trade
Last updated:
apr 23, 2017
Indicators value changes by year
At the date of observation
Value
Absolute change
Change from previous value
jan 1, 1961
0.858
+0.858
0.0%
jan 1, 1962
0.48
-0.379
-44.12%
jan 1, 1963
0.124
-0.355
-74.1%
jan 1, 1964
0.293
+0.169
135.75%
jan 1, 1965
0.32
+0.027
9.38%
jan 1, 1966
0.54
+0.219
68.51%
jan 1, 1967
0.324
-0.215
-39.9%
jan 1, 1968
0.382
+0.058
17.82%
jan 1, 1969
0.288
-0.094
-24.67%
jan 1, 1970
0.339
+0.051
17.57%
jan 1, 1971
0.113
-0.226
-66.71%
jan 1, 1972
0.097
-0.016
-14.2%
jan 1, 1973
0.072
-0.025
-25.97%
jan 1, 1974
0.11
+0.039
53.99%
jan 1, 1975
0.179
+0.069
62.43%
jan 1, 1976
0.316
+0.137
76.52%
jan 1, 1977
0.33
+0.014
4.41%
jan 1, 1978
0.535
+0.205
62.14%
jan 1, 1979
0.466
-0.069
-12.86%
jan 1, 1980
0.402
-0.064
-13.68%
jan 1, 1981
0.596
+0.194
48.19%
jan 1, 1982
0.764
+0.167
28.08%
jan 1, 1983
0.725
-0.038
-5.03%
jan 1, 1984
0.763
+0.038
5.2%
jan 1, 1985
0.593
-0.171
-22.34%
jan 1, 1986
0.71
+0.117
19.77%
jan 1, 1987
0.694
-0.016
-2.27%
jan 1, 1988
0.713
+0.019
2.77%
jan 1, 1989
0.596
-0.117
-16.38%
jan 1, 1990
0.448
-0.148
-24.83%
jan 1, 1991
0.518
+0.07
15.63%
jan 1, 1992
0.504
-0.014
-2.69%
jan 1, 1993
0.598
+0.094
18.58%
jan 1, 1994
0.597
-0.001
-0.18%
jan 1, 1995
0.644
+0.047
7.94%
jan 1, 1996
0.585
-0.06
-9.27%
jan 1, 1997
0.849
+0.264
45.25%
jan 1, 1998
0.421
-0.428
-50.36%
jan 1, 1999
0.518
+0.096
22.89%
jan 1, 2000
0.498
-0.02
-3.78%
jan 1, 2001
0.527
+0.029
5.83%
jan 1, 2002
0.466
-0.061
-11.58%
jan 1, 2003
0.427
-0.039
-8.43%
jan 1, 2004
0.348
-0.079
-18.41%
jan 1, 2005
0.399
+0.051
14.64%
jan 1, 2006
0.535
+0.136
33.95%
jan 1, 2007
0.527
-0.008
-1.41%
jan 1, 2008
0.524
-0.004
-0.73%
jan 1, 2009
0.485
-0.039
-7.46%
jan 1, 2010
0.582
+0.097
20.01%
jan 1, 2011
0.55
-0.031
-5.39%
jan 1, 2012
0.636
+0.085
15.53%
jan 1, 2013
0.649
+0.014
2.13%
jan 1, 2014
0.557
-0.092
-14.17%
jan 1, 2015
0.52
-0.037
-6.66%
Ranking of countries by current statistics by years


Comments: