29
/
en
AIzaSyAYiBZKx7MnpbEhh9jyipgxe19OcubqV5w
April 1, 2024
100195
Cameroon
CMR
true
2
1
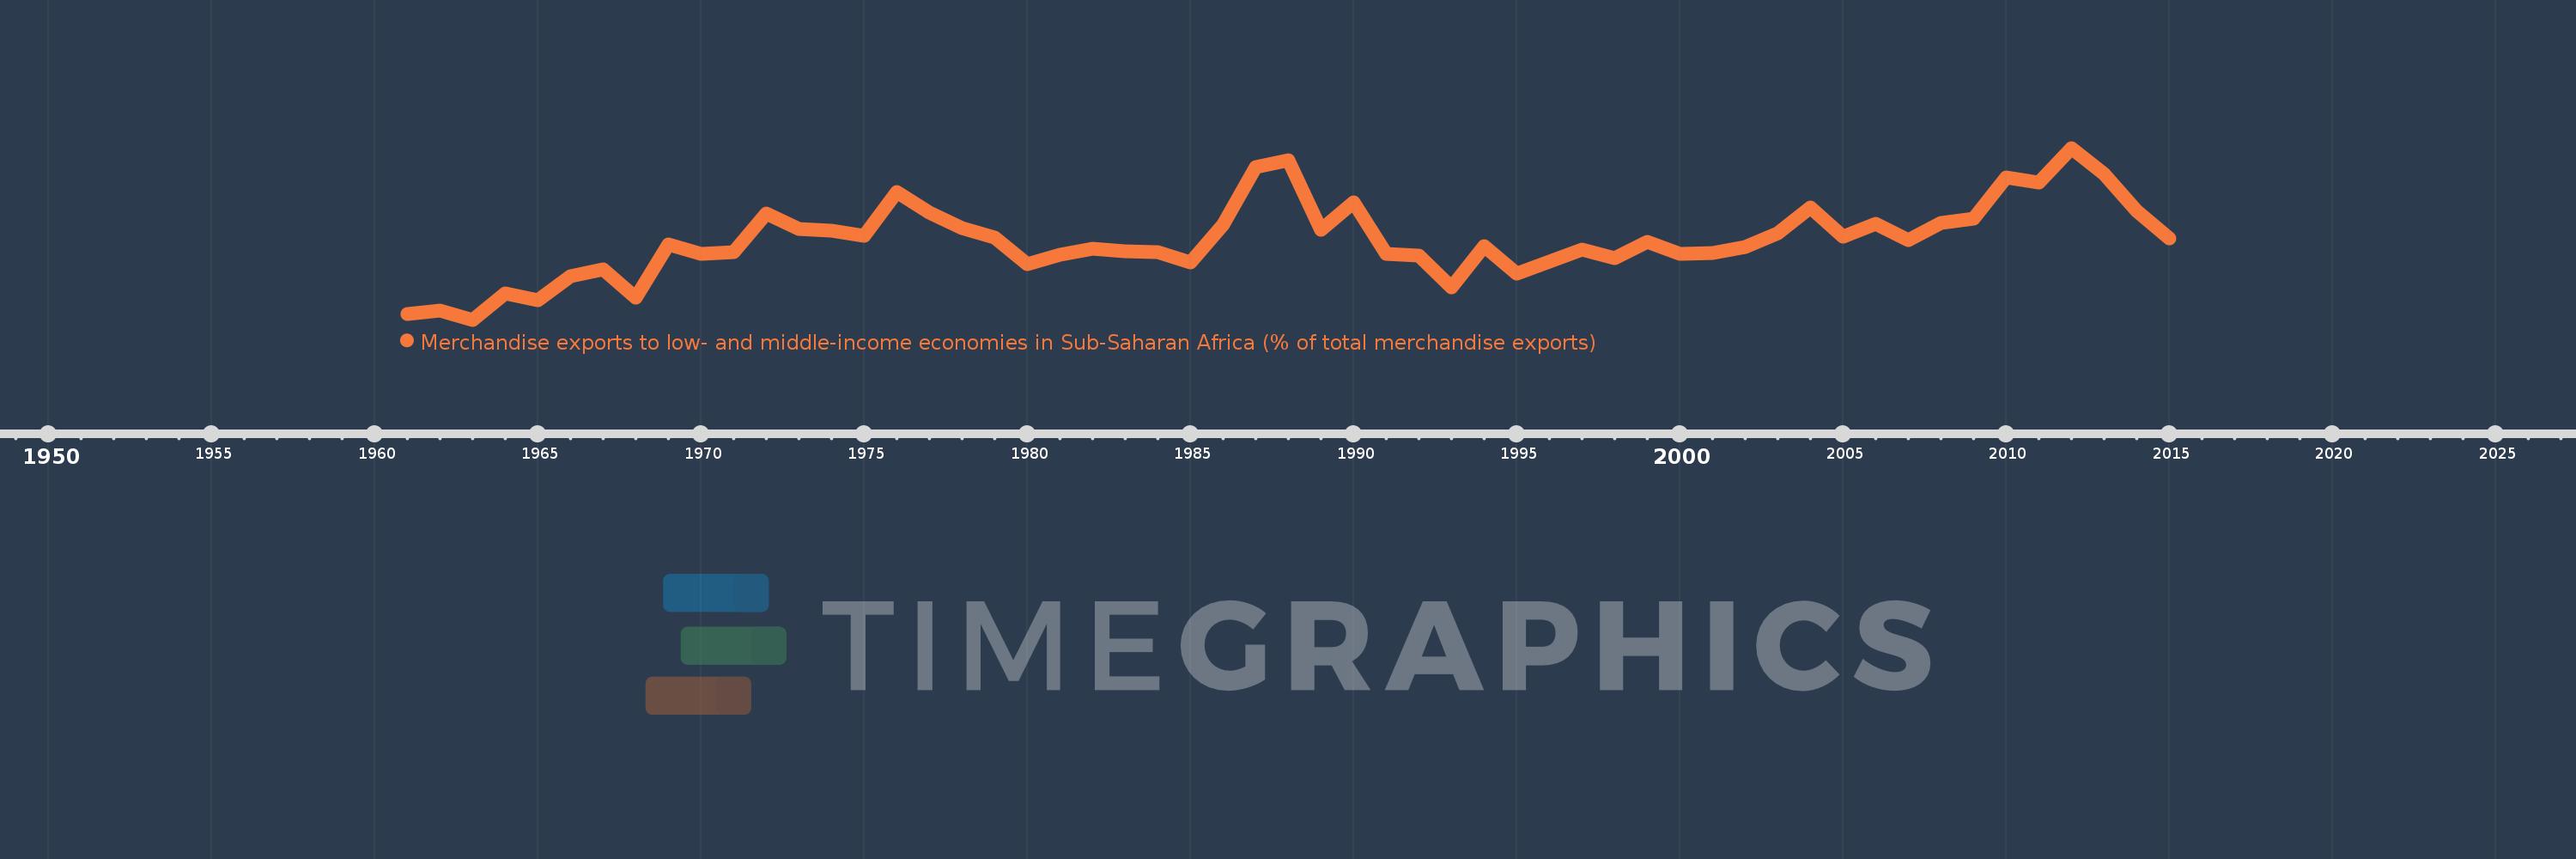
Merchandise exports to low- and middle-income economies in Sub-Saharan Africa (% of total merchandise exports)
2015,2014,2013,2012,2011,2010,2009,2008,2007,2006,2005,2004,2003,2002,2001,2000,1999,1998,1997,1996,1995,1994,1993,1992,1991,1990,1989,1988,1987,1986,1985,1984,1983,1982,1981,1980,1979,1978,1977,1976,1975,1974,1973,1972,1971,1970,1969,1968,1967,1966,1965,1964,1963,1962,1961
This statistics in other country:
AfghanistanAlbaniaAlgeriaAngolaArab WorldArgentinaArmeniaAustraliaAustriaAzerbaijanBahamas, TheBahrainBangladeshBarbadosBelarusBelgiumBelizeBeninBermudaBoliviaBrazilBulgariaBurkina FasoBurundiCabo VerdeCambodiaCameroonCanadaCaribbean small statesCentral African RepublicCentral Europe and the BalticsChadChileChinaColombiaCongo, Dem. Rep.Congo, Rep.Costa RicaCote d'IvoireCroatiaCubaCyprusCzech RepublicDenmarkDjiboutiDominicaDominican RepublicEarly-demographic dividendEast Asia & PacificEast Asia & Pacific (excluding high income)East Asia & Pacific (IDA & IBRD countries)EcuadorEgypt, Arab Rep.EstoniaEthiopiaEuro areaEurope & Central AsiaEurope & Central Asia (excluding high income)Europe & Central Asia (IDA & IBRD countries)European UnionFijiFinlandFragile and conflict affected situationsFranceGabonGambia, TheGeorgiaGermanyGhanaGibraltarGreeceGreenlandGuatemalaGuineaGuinea-BissauGuyanaHaitiHeavily indebted poor countries (HIPC)High incomeHondurasHong Kong SAR, ChinaHungaryIBRD onlyIcelandIDA & IBRD totalIDA blendIDA onlyIDA totalIndiaIndonesiaIran, Islamic Rep.IraqIrelandIsraelItalyJamaicaJapanJordanKazakhstanKenyaKorea, Dem. People’s Rep.Korea, Rep.KuwaitLao PDRLate-demographic dividendLatin America & Caribbean Latin America & Caribbean (excluding high income)Latin America & the Caribbean (IDA & IBRD countries)LatviaLeast developed countries: UN classificationLebanonLiberiaLibyaLithuaniaLow & middle incomeLow incomeLower middle incomeLuxembourgMacao SAR, ChinaMacedonia, FYRMadagascarMalawiMalaysiaMaliMaltaMauritaniaMauritiusMexicoMiddle East & North AfricaMiddle East & North Africa (excluding high income)Middle East & North Africa (IDA & IBRD countries)Middle incomeMoldovaMontenegroMoroccoMozambiqueMyanmarNetherlandsNew ZealandNicaraguaNigerNigeriaNorth AmericaNorwayOECD membersOmanOther small statesPacific island small statesPakistanPanamaPapua New GuineaParaguayPeruPhilippinesPolandPortugalPost-demographic dividendPre-demographic dividendQatarRomaniaRussian FederationRwandaSaudi ArabiaSenegalSerbiaSeychellesSierra LeoneSingaporeSlovak RepublicSloveniaSmall statesSomaliaSouth AfricaSouth AsiaSouth Asia (IDA & IBRD)SpainSri LankaSt. LuciaSt. Vincent and the GrenadinesSub-Saharan Africa Sub-Saharan Africa (excluding high income)Sub-Saharan Africa (IDA & IBRD countries)SudanSurinameSwedenSwitzerlandSyrian Arab RepublicTanzaniaThailandTogoTrinidad and TobagoTunisiaTurkeyUgandaUkraineUnited Arab EmiratesUnited KingdomUnited StatesUpper middle incomeUruguayVenezuela, RBVietnamWorldYemen, Rep.ZambiaZimbabwe Timeline:
This timeline shows a graph from 1961 to 2015 of Cameroon. No data until 1960. Number of actual observations by date: 55.
Source name:
World Development Indicators
Source organization:
World Bank staff estimates based data from International Monetary Fund's Direction of Trade database.
Categories, topics:
Private Sector, Trade
Last updated:
apr 23, 2017
Indicators value changes by year
Maximum:
17.997
jan 1, 2012
At the date of observation
Value
Absolute change
Change from previous value
jan 1, 1961
0.619
+0.619
0.0%
jan 1, 1962
0.919
+0.3
48.47%
jan 1, 1963
0.0
-0.919
-100.0%
jan 1, 1964
2.719
+2.719
%
jan 1, 1965
2.0
-0.719
-26.44%
jan 1, 1966
4.557
+2.557
127.85%
jan 1, 1967
5.259
+0.702
15.41%
jan 1, 1968
2.303
-2.956
-56.2%
jan 1, 1969
7.906
+5.603
243.23%
jan 1, 1970
6.887
-1.019
-12.89%
jan 1, 1971
7.096
+0.209
3.04%
jan 1, 1972
11.123
+4.027
56.75%
jan 1, 1973
9.549
-1.574
-14.15%
jan 1, 1974
9.326
-0.223
-2.33%
jan 1, 1975
8.82
-0.507
-5.43%
jan 1, 1976
13.399
+4.58
51.93%
jan 1, 1977
11.221
-2.179
-16.26%
jan 1, 1978
9.581
-1.64
-14.61%
jan 1, 1979
8.641
-0.94
-9.81%
jan 1, 1980
5.861
-2.78
-32.17%
jan 1, 1981
6.835
+0.974
16.61%
jan 1, 1982
7.442
+0.607
8.87%
jan 1, 1983
7.196
-0.245
-3.3%
jan 1, 1984
7.058
-0.138
-1.92%
jan 1, 1985
5.983
-1.075
-15.23%
jan 1, 1986
9.924
+3.941
65.87%
jan 1, 1987
15.963
+6.039
60.85%
jan 1, 1988
16.746
+0.784
4.91%
jan 1, 1989
9.442
-7.304
-43.62%
jan 1, 1990
12.296
+2.854
30.23%
jan 1, 1991
6.927
-5.37
-43.67%
jan 1, 1992
6.718
-0.209
-3.02%
jan 1, 1993
3.355
-3.363
-50.07%
jan 1, 1994
7.756
+4.402
131.22%
jan 1, 1995
4.836
-2.92
-37.65%
jan 1, 1996
6.117
+1.281
26.5%
jan 1, 1997
7.391
+1.274
20.82%
jan 1, 1998
6.417
-0.974
-13.18%
jan 1, 1999
8.182
+1.765
27.51%
jan 1, 2000
6.945
-1.237
-15.12%
jan 1, 2001
7.035
+0.091
1.31%
jan 1, 2002
7.62
+0.585
8.31%
jan 1, 2003
9.05
+1.429
18.76%
jan 1, 2004
11.776
+2.727
30.13%
jan 1, 2005
8.708
-3.068
-26.05%
jan 1, 2006
10.032
+1.323
15.2%
jan 1, 2007
8.345
-1.687
-16.81%
jan 1, 2008
10.107
+1.762
21.12%
jan 1, 2009
10.627
+0.52
5.15%
jan 1, 2010
14.87
+4.243
39.92%
jan 1, 2011
14.342
-0.528
-3.55%
jan 1, 2012
17.997
+3.655
25.49%
jan 1, 2013
15.28
-2.718
-15.1%
jan 1, 2014
11.391
-3.889
-25.45%
jan 1, 2015
8.5
-2.89
-25.37%
Ranking of countries by current statistics by years


Comments: