29
/
en
AIzaSyAYiBZKx7MnpbEhh9jyipgxe19OcubqV5w
April 1, 2024
158656
Iraq
IRQ
true
2
1
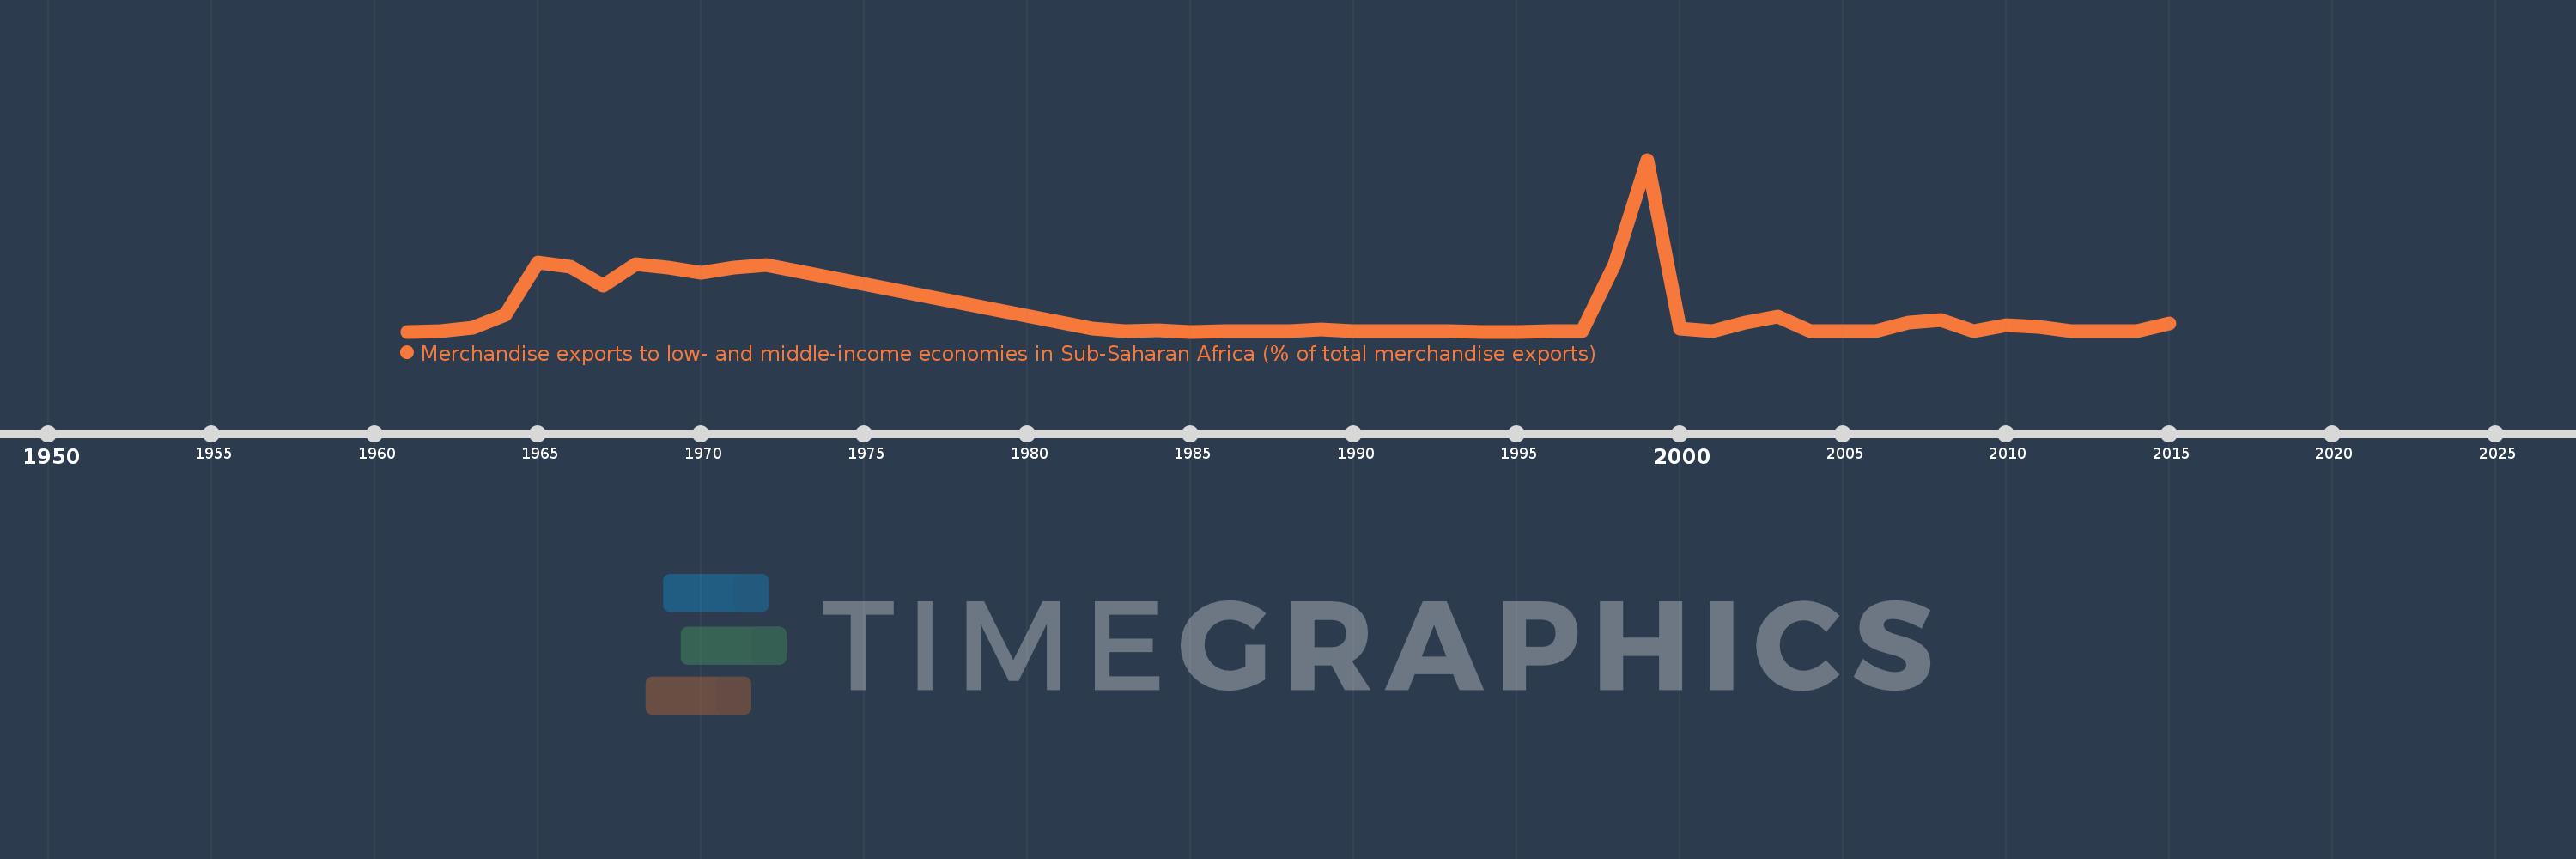
Merchandise exports to low- and middle-income economies in Sub-Saharan Africa (% of total merchandise exports)
2015,2014,2013,2012,2011,2010,2009,2008,2007,2006,2005,2004,2003,2002,2001,2000,1999,1998,1997,1996,1995,1994,1993,1992,1991,1990,1989,1988,1987,1986,1985,1984,1983,1982,1972,1971,1970,1969,1968,1967,1966,1965,1964,1963,1962,1961
This statistics in other country:
AfghanistanAlbaniaAlgeriaAngolaArab WorldArgentinaArmeniaAustraliaAustriaAzerbaijanBahamas, TheBahrainBangladeshBarbadosBelarusBelgiumBelizeBeninBermudaBoliviaBrazilBulgariaBurkina FasoBurundiCabo VerdeCambodiaCameroonCanadaCaribbean small statesCentral African RepublicCentral Europe and the BalticsChadChileChinaColombiaCongo, Dem. Rep.Congo, Rep.Costa RicaCote d'IvoireCroatiaCubaCyprusCzech RepublicDenmarkDjiboutiDominicaDominican RepublicEarly-demographic dividendEast Asia & PacificEast Asia & Pacific (excluding high income)East Asia & Pacific (IDA & IBRD countries)EcuadorEgypt, Arab Rep.EstoniaEthiopiaEuro areaEurope & Central AsiaEurope & Central Asia (excluding high income)Europe & Central Asia (IDA & IBRD countries)European UnionFijiFinlandFragile and conflict affected situationsFranceGabonGambia, TheGeorgiaGermanyGhanaGibraltarGreeceGreenlandGuatemalaGuineaGuinea-BissauGuyanaHaitiHeavily indebted poor countries (HIPC)High incomeHondurasHong Kong SAR, ChinaHungaryIBRD onlyIcelandIDA & IBRD totalIDA blendIDA onlyIDA totalIndiaIndonesiaIran, Islamic Rep.IraqIrelandIsraelItalyJamaicaJapanJordanKazakhstanKenyaKorea, Dem. People’s Rep.Korea, Rep.KuwaitLao PDRLate-demographic dividendLatin America & Caribbean Latin America & Caribbean (excluding high income)Latin America & the Caribbean (IDA & IBRD countries)LatviaLeast developed countries: UN classificationLebanonLiberiaLibyaLithuaniaLow & middle incomeLow incomeLower middle incomeLuxembourgMacao SAR, ChinaMacedonia, FYRMadagascarMalawiMalaysiaMaliMaltaMauritaniaMauritiusMexicoMiddle East & North AfricaMiddle East & North Africa (excluding high income)Middle East & North Africa (IDA & IBRD countries)Middle incomeMoldovaMontenegroMoroccoMozambiqueMyanmarNetherlandsNew ZealandNicaraguaNigerNigeriaNorth AmericaNorwayOECD membersOmanOther small statesPacific island small statesPakistanPanamaPapua New GuineaParaguayPeruPhilippinesPolandPortugalPost-demographic dividendPre-demographic dividendQatarRomaniaRussian FederationRwandaSaudi ArabiaSenegalSerbiaSeychellesSierra LeoneSingaporeSlovak RepublicSloveniaSmall statesSomaliaSouth AfricaSouth AsiaSouth Asia (IDA & IBRD)SpainSri LankaSt. LuciaSt. Vincent and the GrenadinesSub-Saharan Africa Sub-Saharan Africa (excluding high income)Sub-Saharan Africa (IDA & IBRD countries)SudanSurinameSwedenSwitzerlandSyrian Arab RepublicTanzaniaThailandTogoTrinidad and TobagoTunisiaTurkeyUgandaUkraineUnited Arab EmiratesUnited KingdomUnited StatesUpper middle incomeUruguayVenezuela, RBVietnamWorldYemen, Rep.ZambiaZimbabwe Timeline:
This timeline shows a graph from 1961 to 2015 of Iraq. No data until 1960. Number of actual observations by date: 46.
Source name:
World Development Indicators
Source organization:
World Bank staff estimates based data from International Monetary Fund's Direction of Trade database.
Categories, topics:
Private Sector, Trade
Last updated:
apr 23, 2017
Indicators value changes by year
Maximum:
10.714
jan 1, 1999
At the date of observation
Value
Absolute change
Change from previous value
jan 1, 1963
0.261
+0.231
760.88%
jan 1, 1964
1.071
+0.81
310.44%
jan 1, 1965
4.292
+3.221
300.9%
jan 1, 1966
4.025
-0.266
-6.21%
jan 1, 1967
2.857
-1.169
-29.04%
jan 1, 1968
4.219
+1.363
47.7%
jan 1, 1969
3.97
-0.249
-5.9%
jan 1, 1970
3.687
-0.283
-7.12%
jan 1, 1971
3.999
+0.312
8.46%
jan 1, 1972
4.177
+0.178
4.45%
jan 1, 1982
0.199
-3.979
-95.25%
jan 1, 1983
0.004
-0.194
-97.96%
jan 1, 1984
0.064
+0.06
1.47K%
jan 1, 1985
0.0
-0.063
-99.51%
jan 1, 1986
0.002
+0.002
616.03%
jan 1, 1987
0.011
+0.008
374.43%
jan 1, 1988
0.005
-0.005
-50.17%
jan 1, 1989
0.125
+0.119
2.26K%
jan 1, 1990
0.013
-0.112
-89.94%
jan 1, 1991
0.012
-0.001
-4.41%
jan 1, 1992
0.01
-0.002
-14.51%
jan 1, 1993
0.028
+0.018
170.99%
jan 1, 1994
0.0
-0.028
-99.28%
jan 1, 1995
0.0
0.0
-66.26%
jan 1, 1996
0.008
+0.008
12.37K%
jan 1, 1997
0.005
-0.004
-43.27%
jan 1, 1998
4.212
+4.208
87.51K%
jan 1, 1999
10.714
+6.501
154.33%
jan 1, 2000
0.192
-10.521
-98.21%
jan 1, 2001
0.001
-0.191
-99.48%
jan 1, 2002
0.575
+0.574
57.71K%
jan 1, 2003
0.95
+0.375
65.15%
jan 1, 2004
0.002
-0.948
-99.8%
jan 1, 2005
0.018
+0.016
826.37%
jan 1, 2006
0.005
-0.013
-74.64%
jan 1, 2007
0.566
+0.561
12.42K%
jan 1, 2008
0.733
+0.167
29.56%
jan 1, 2009
0.008
-0.725
-98.96%
jan 1, 2010
0.423
+0.415
5.47K%
jan 1, 2011
0.282
-0.141
-33.4%
jan 1, 2012
0.001
-0.281
-99.63%
jan 1, 2013
0.001
0.0
-31.42%
jan 1, 2014
0.001
+0.001
71.89%
jan 1, 2015
0.503
+0.502
40.85K%
Ranking of countries by current statistics by years


Comments: