29
/
en
AIzaSyAYiBZKx7MnpbEhh9jyipgxe19OcubqV5w
April 1, 2024
83057
Belize
BLZ
true
2
1
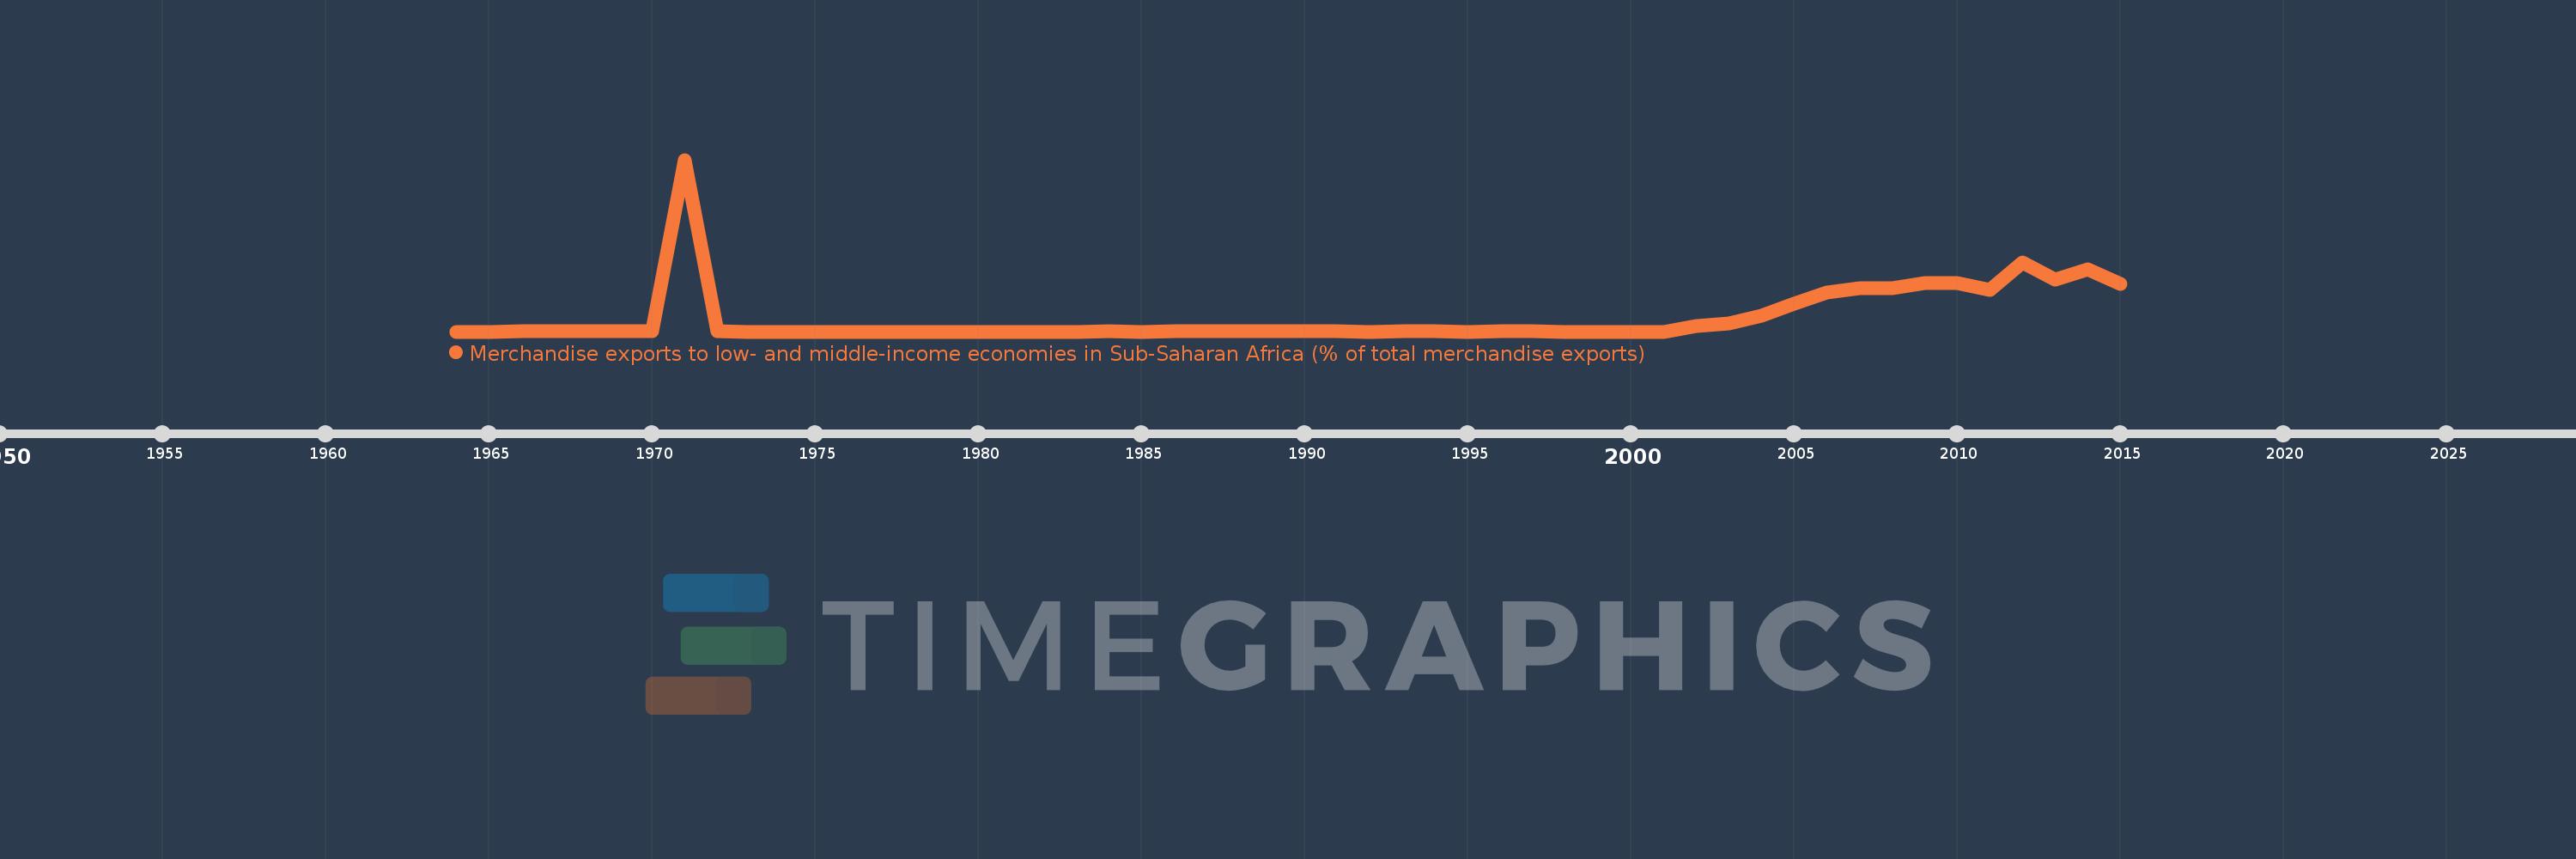
Merchandise exports to low- and middle-income economies in Sub-Saharan Africa (% of total merchandise exports)
2015,2014,2013,2012,2011,2010,2009,2008,2007,2006,2005,2004,2003,2002,2001,2000,1999,1998,1997,1996,1995,1994,1993,1992,1991,1990,1989,1988,1987,1986,1985,1984,1983,1982,1980,1979,1978,1977,1976,1975,1974,1973,1972,1971,1970,1969,1968,1967,1966,1965,1964
This statistics in other country:
AfghanistanAlbaniaAlgeriaAngolaArab WorldArgentinaArmeniaAustraliaAustriaAzerbaijanBahamas, TheBahrainBangladeshBarbadosBelarusBelgiumBelizeBeninBermudaBoliviaBrazilBulgariaBurkina FasoBurundiCabo VerdeCambodiaCameroonCanadaCaribbean small statesCentral African RepublicCentral Europe and the BalticsChadChileChinaColombiaCongo, Dem. Rep.Congo, Rep.Costa RicaCote d'IvoireCroatiaCubaCyprusCzech RepublicDenmarkDjiboutiDominicaDominican RepublicEarly-demographic dividendEast Asia & PacificEast Asia & Pacific (excluding high income)East Asia & Pacific (IDA & IBRD countries)EcuadorEgypt, Arab Rep.EstoniaEthiopiaEuro areaEurope & Central AsiaEurope & Central Asia (excluding high income)Europe & Central Asia (IDA & IBRD countries)European UnionFijiFinlandFragile and conflict affected situationsFranceGabonGambia, TheGeorgiaGermanyGhanaGibraltarGreeceGreenlandGuatemalaGuineaGuinea-BissauGuyanaHaitiHeavily indebted poor countries (HIPC)High incomeHondurasHong Kong SAR, ChinaHungaryIBRD onlyIcelandIDA & IBRD totalIDA blendIDA onlyIDA totalIndiaIndonesiaIran, Islamic Rep.IraqIrelandIsraelItalyJamaicaJapanJordanKazakhstanKenyaKorea, Dem. People’s Rep.Korea, Rep.KuwaitLao PDRLate-demographic dividendLatin America & Caribbean Latin America & Caribbean (excluding high income)Latin America & the Caribbean (IDA & IBRD countries)LatviaLeast developed countries: UN classificationLebanonLiberiaLibyaLithuaniaLow & middle incomeLow incomeLower middle incomeLuxembourgMacao SAR, ChinaMacedonia, FYRMadagascarMalawiMalaysiaMaliMaltaMauritaniaMauritiusMexicoMiddle East & North AfricaMiddle East & North Africa (excluding high income)Middle East & North Africa (IDA & IBRD countries)Middle incomeMoldovaMontenegroMoroccoMozambiqueMyanmarNetherlandsNew ZealandNicaraguaNigerNigeriaNorth AmericaNorwayOECD membersOmanOther small statesPacific island small statesPakistanPanamaPapua New GuineaParaguayPeruPhilippinesPolandPortugalPost-demographic dividendPre-demographic dividendQatarRomaniaRussian FederationRwandaSaudi ArabiaSenegalSerbiaSeychellesSierra LeoneSingaporeSlovak RepublicSloveniaSmall statesSomaliaSouth AfricaSouth AsiaSouth Asia (IDA & IBRD)SpainSri LankaSt. LuciaSt. Vincent and the GrenadinesSub-Saharan Africa Sub-Saharan Africa (excluding high income)Sub-Saharan Africa (IDA & IBRD countries)SudanSurinameSwedenSwitzerlandSyrian Arab RepublicTanzaniaThailandTogoTrinidad and TobagoTunisiaTurkeyUgandaUkraineUnited Arab EmiratesUnited KingdomUnited StatesUpper middle incomeUruguayVenezuela, RBVietnamWorldYemen, Rep.ZambiaZimbabwe Timeline:
This timeline shows a graph from 1964 to 2015 of Belize. No data until 1963. Number of actual observations by date: 51.
Source name:
World Development Indicators
Source organization:
World Bank staff estimates based data from International Monetary Fund's Direction of Trade database.
Categories, topics:
Private Sector, Trade
Last updated:
apr 23, 2017
Indicators value changes by year
Maximum:
29.562
jan 1, 1971
At the date of observation
Value
Absolute change
Change from previous value
jan 1, 1966
0.008
+0.008
%
jan 1, 1967
0.05
+0.042
513.56%
jan 1, 1968
0.035
-0.015
-30.18%
jan 1, 1969
0.007
-0.028
-81.08%
jan 1, 1970
0.047
+0.041
617.89%
jan 1, 1971
29.562
+29.514
62.15K%
jan 1, 1972
0.089
-29.472
-99.7%
jan 1, 1973
0.0
-0.089
-100.0%
jan 1, 1984
0.003
+0.003
%
jan 1, 1985
0.0
-0.003
-100.0%
jan 1, 1986
0.002
+0.002
%
jan 1, 1987
0.005
+0.003
143.25%
jan 1, 1988
0.002
-0.003
-62.72%
jan 1, 1989
0.022
+0.02
1.01K%
jan 1, 1990
0.008
-0.014
-63.93%
jan 1, 1991
0.019
+0.011
136.66%
jan 1, 1992
0.0
-0.019
-100.0%
jan 1, 1993
0.016
+0.016
%
jan 1, 1994
0.001
-0.014
-92.63%
jan 1, 1995
0.0
-0.001
-100.0%
jan 1, 1996
0.006
+0.006
%
jan 1, 1997
0.007
+0.001
10.69%
jan 1, 1998
0.0
-0.007
-100.0%
jan 1, 2002
0.912
+0.912
%
jan 1, 2003
1.379
+0.467
51.2%
jan 1, 2004
2.698
+1.32
95.73%
jan 1, 2005
4.755
+2.057
76.22%
jan 1, 2006
6.664
+1.909
40.16%
jan 1, 2007
7.394
+0.73
10.95%
jan 1, 2008
7.532
+0.138
1.87%
jan 1, 2009
8.361
+0.829
11.01%
jan 1, 2010
8.388
+0.027
0.32%
jan 1, 2011
7.179
-1.21
-14.42%
jan 1, 2012
11.93
+4.751
66.18%
jan 1, 2013
8.935
-2.995
-25.1%
jan 1, 2014
10.647
+1.712
19.17%
jan 1, 2015
8.233
-2.414
-22.68%
Ranking of countries by current statistics by years


Comments: