29
/
en
AIzaSyAYiBZKx7MnpbEhh9jyipgxe19OcubqV5w
April 1, 2024
37548
IDA & IBRD total
IBT
false
2
1
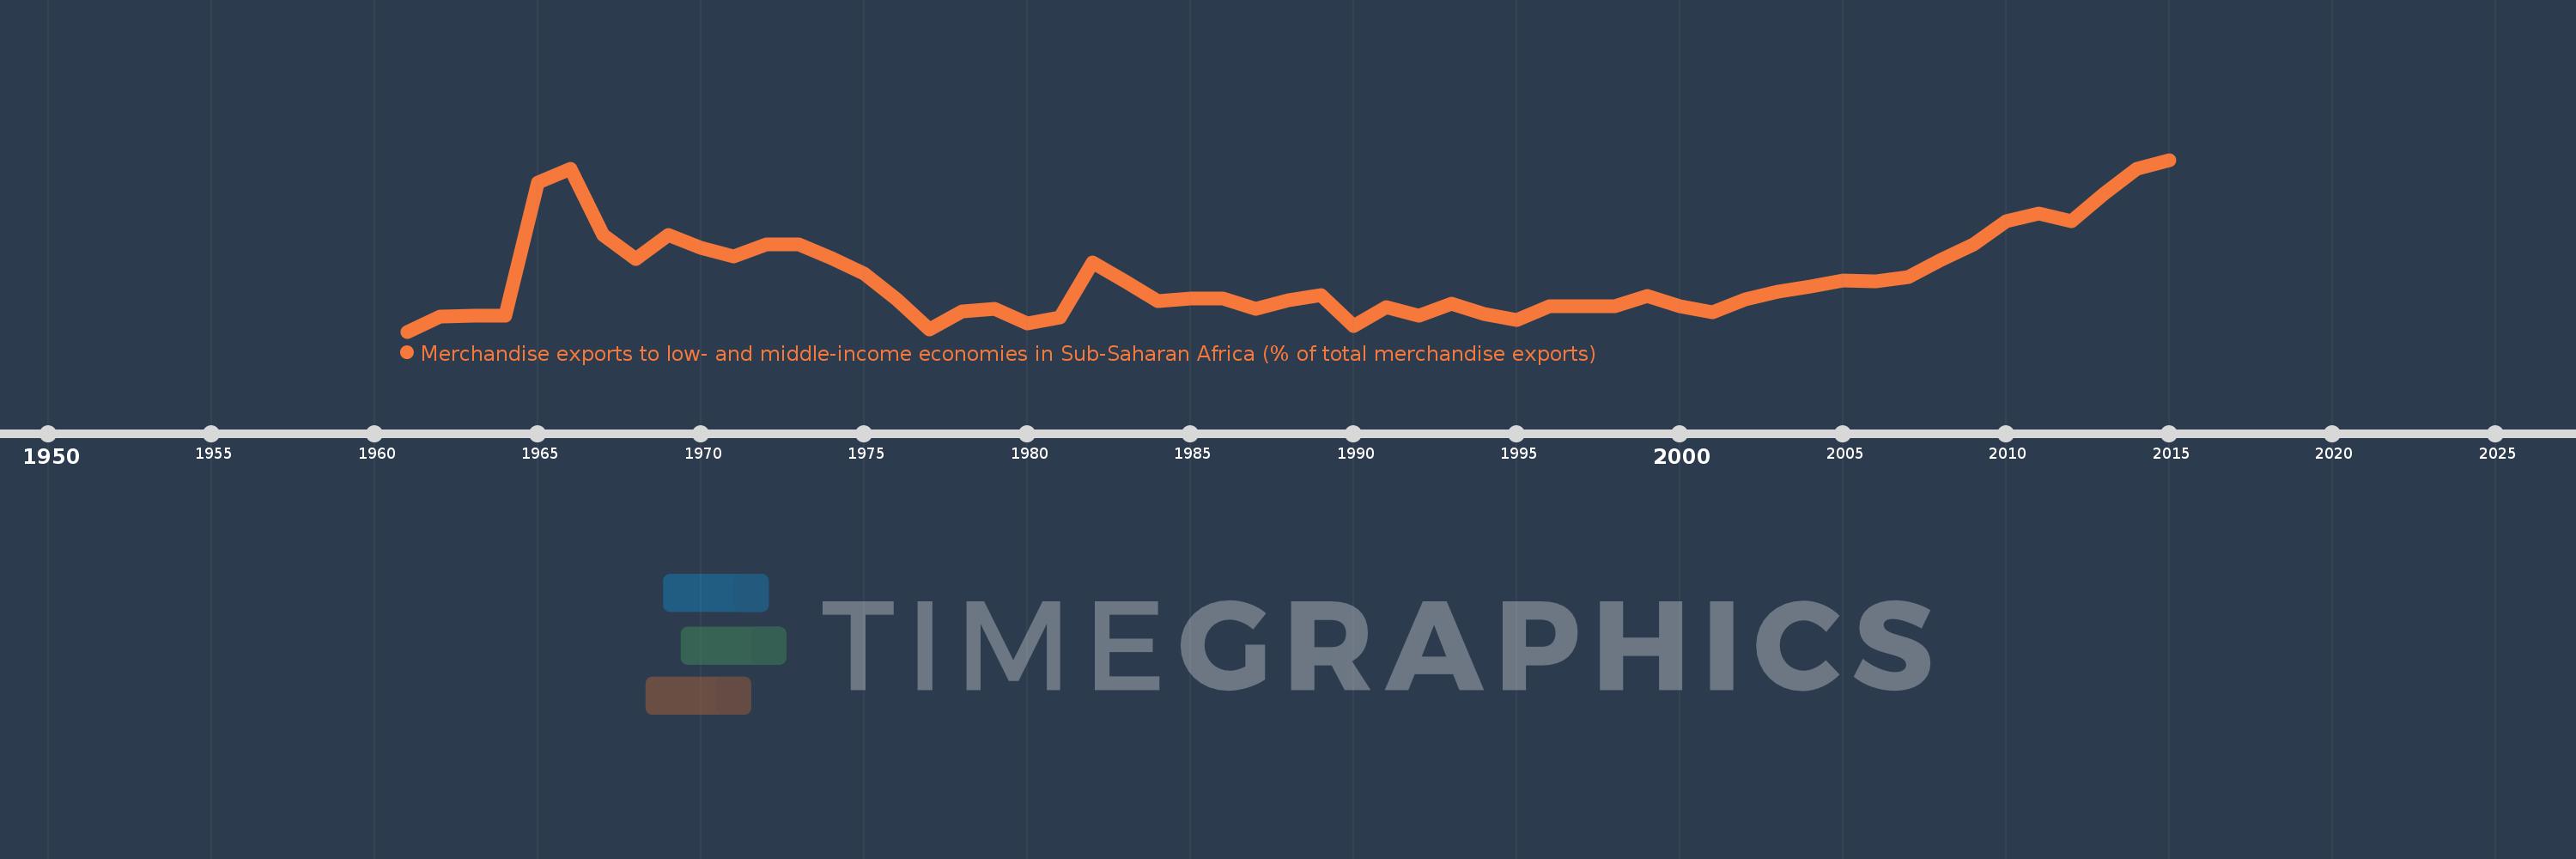
Merchandise exports to low- and middle-income economies in Sub-Saharan Africa (% of total merchandise exports)
2015,2014,2013,2012,2011,2010,2009,2008,2007,2006,2005,2004,2003,2002,2001,2000,1999,1998,1997,1996,1995,1994,1993,1992,1991,1990,1989,1988,1987,1986,1985,1984,1983,1982,1981,1980,1979,1978,1977,1976,1975,1974,1973,1972,1971,1970,1969,1968,1967,1966,1965,1964,1963,1962,1961
This statistics in other country:
AfghanistanAlbaniaAlgeriaAngolaArab WorldArgentinaArmeniaAustraliaAustriaAzerbaijanBahamas, TheBahrainBangladeshBarbadosBelarusBelgiumBelizeBeninBermudaBoliviaBrazilBulgariaBurkina FasoBurundiCabo VerdeCambodiaCameroonCanadaCaribbean small statesCentral African RepublicCentral Europe and the BalticsChadChileChinaColombiaCongo, Dem. Rep.Congo, Rep.Costa RicaCote d'IvoireCroatiaCubaCyprusCzech RepublicDenmarkDjiboutiDominicaDominican RepublicEarly-demographic dividendEast Asia & PacificEast Asia & Pacific (excluding high income)East Asia & Pacific (IDA & IBRD countries)EcuadorEgypt, Arab Rep.EstoniaEthiopiaEuro areaEurope & Central AsiaEurope & Central Asia (excluding high income)Europe & Central Asia (IDA & IBRD countries)European UnionFijiFinlandFragile and conflict affected situationsFranceGabonGambia, TheGeorgiaGermanyGhanaGibraltarGreeceGreenlandGuatemalaGuineaGuinea-BissauGuyanaHaitiHeavily indebted poor countries (HIPC)High incomeHondurasHong Kong SAR, ChinaHungaryIBRD onlyIcelandIDA & IBRD totalIDA blendIDA onlyIDA totalIndiaIndonesiaIran, Islamic Rep.IraqIrelandIsraelItalyJamaicaJapanJordanKazakhstanKenyaKorea, Dem. People’s Rep.Korea, Rep.KuwaitLao PDRLate-demographic dividendLatin America & Caribbean Latin America & Caribbean (excluding high income)Latin America & the Caribbean (IDA & IBRD countries)LatviaLeast developed countries: UN classificationLebanonLiberiaLibyaLithuaniaLow & middle incomeLow incomeLower middle incomeLuxembourgMacao SAR, ChinaMacedonia, FYRMadagascarMalawiMalaysiaMaliMaltaMauritaniaMauritiusMexicoMiddle East & North AfricaMiddle East & North Africa (excluding high income)Middle East & North Africa (IDA & IBRD countries)Middle incomeMoldovaMontenegroMoroccoMozambiqueMyanmarNetherlandsNew ZealandNicaraguaNigerNigeriaNorth AmericaNorwayOECD membersOmanOther small statesPacific island small statesPakistanPanamaPapua New GuineaParaguayPeruPhilippinesPolandPortugalPost-demographic dividendPre-demographic dividendQatarRomaniaRussian FederationRwandaSaudi ArabiaSenegalSerbiaSeychellesSierra LeoneSingaporeSlovak RepublicSloveniaSmall statesSomaliaSouth AfricaSouth AsiaSouth Asia (IDA & IBRD)SpainSri LankaSt. LuciaSt. Vincent and the GrenadinesSub-Saharan Africa Sub-Saharan Africa (excluding high income)Sub-Saharan Africa (IDA & IBRD countries)SudanSurinameSwedenSwitzerlandSyrian Arab RepublicTanzaniaThailandTogoTrinidad and TobagoTunisiaTurkeyUgandaUkraineUnited Arab EmiratesUnited KingdomUnited StatesUpper middle incomeUruguayVenezuela, RBVietnamWorldYemen, Rep.ZambiaZimbabwe Timeline:
This timeline shows a graph from 1961 to 2015 of IDA & IBRD total. No data until 1960. Number of actual observations by date: 55.
Source name:
World Development Indicators
Source organization:
World Bank staff estimates based data from International Monetary Fund's Direction of Trade database.
Categories, topics:
Private Sector, Trade
Last updated:
apr 23, 2017
Indicators value changes by year
At the date of observation
Value
Absolute change
Change from previous value
jan 1, 1961
1.434
+1.434
0.0%
jan 1, 1962
1.6
+0.166
11.58%
jan 1, 1963
1.617
+0.017
1.06%
jan 1, 1964
1.618
+0.001
0.09%
jan 1, 1965
3.122
+1.504
92.97%
jan 1, 1966
3.279
+0.157
5.03%
jan 1, 1967
2.528
-0.751
-22.91%
jan 1, 1968
2.257
-0.271
-10.71%
jan 1, 1969
2.525
+0.267
11.85%
jan 1, 1970
2.379
-0.146
-5.78%
jan 1, 1971
2.283
-0.096
-4.04%
jan 1, 1972
2.417
+0.134
5.87%
jan 1, 1973
2.424
+0.007
0.31%
jan 1, 1974
2.264
-0.16
-6.59%
jan 1, 1975
2.087
-0.177
-7.83%
jan 1, 1976
1.795
-0.292
-14.0%
jan 1, 1977
1.46
-0.335
-18.65%
jan 1, 1978
1.66
+0.2
13.67%
jan 1, 1979
1.687
+0.028
1.67%
jan 1, 1980
1.524
-0.164
-9.7%
jan 1, 1981
1.598
+0.075
4.92%
jan 1, 1982
2.212
+0.613
38.38%
jan 1, 1983
2.002
-0.21
-9.48%
jan 1, 1984
1.775
-0.227
-11.35%
jan 1, 1985
1.805
+0.03
1.71%
jan 1, 1986
1.807
+0.002
0.11%
jan 1, 1987
1.69
-0.117
-6.47%
jan 1, 1988
1.786
+0.095
5.65%
jan 1, 1989
1.85
+0.064
3.58%
jan 1, 1990
1.502
-0.348
-18.82%
jan 1, 1991
1.707
+0.205
13.67%
jan 1, 1992
1.609
-0.098
-5.72%
jan 1, 1993
1.75
+0.14
8.71%
jan 1, 1994
1.634
-0.116
-6.61%
jan 1, 1995
1.562
-0.072
-4.38%
jan 1, 1996
1.725
+0.162
10.39%
jan 1, 1997
1.72
-0.005
-0.26%
jan 1, 1998
1.724
+0.004
0.25%
jan 1, 1999
1.839
+0.115
6.66%
jan 1, 2000
1.722
-0.117
-6.38%
jan 1, 2001
1.65
-0.072
-4.16%
jan 1, 2002
1.8
+0.15
9.1%
jan 1, 2003
1.887
+0.087
4.82%
jan 1, 2004
1.943
+0.056
2.95%
jan 1, 2005
2.016
+0.074
3.79%
jan 1, 2006
2.007
-0.01
-0.49%
jan 1, 2007
2.054
+0.048
2.38%
jan 1, 2008
2.242
+0.188
9.13%
jan 1, 2009
2.424
+0.182
8.14%
jan 1, 2010
2.679
+0.254
10.48%
jan 1, 2011
2.775
+0.096
3.6%
jan 1, 2012
2.686
-0.089
-3.21%
jan 1, 2013
2.992
+0.307
11.41%
jan 1, 2014
3.274
+0.281
9.41%
jan 1, 2015
3.378
+0.104
3.17%
Ranking of countries by current statistics by years


Comments: