29
/
en
AIzaSyAYiBZKx7MnpbEhh9jyipgxe19OcubqV5w
April 1, 2024
139523
Germany
DEU
true
2
1
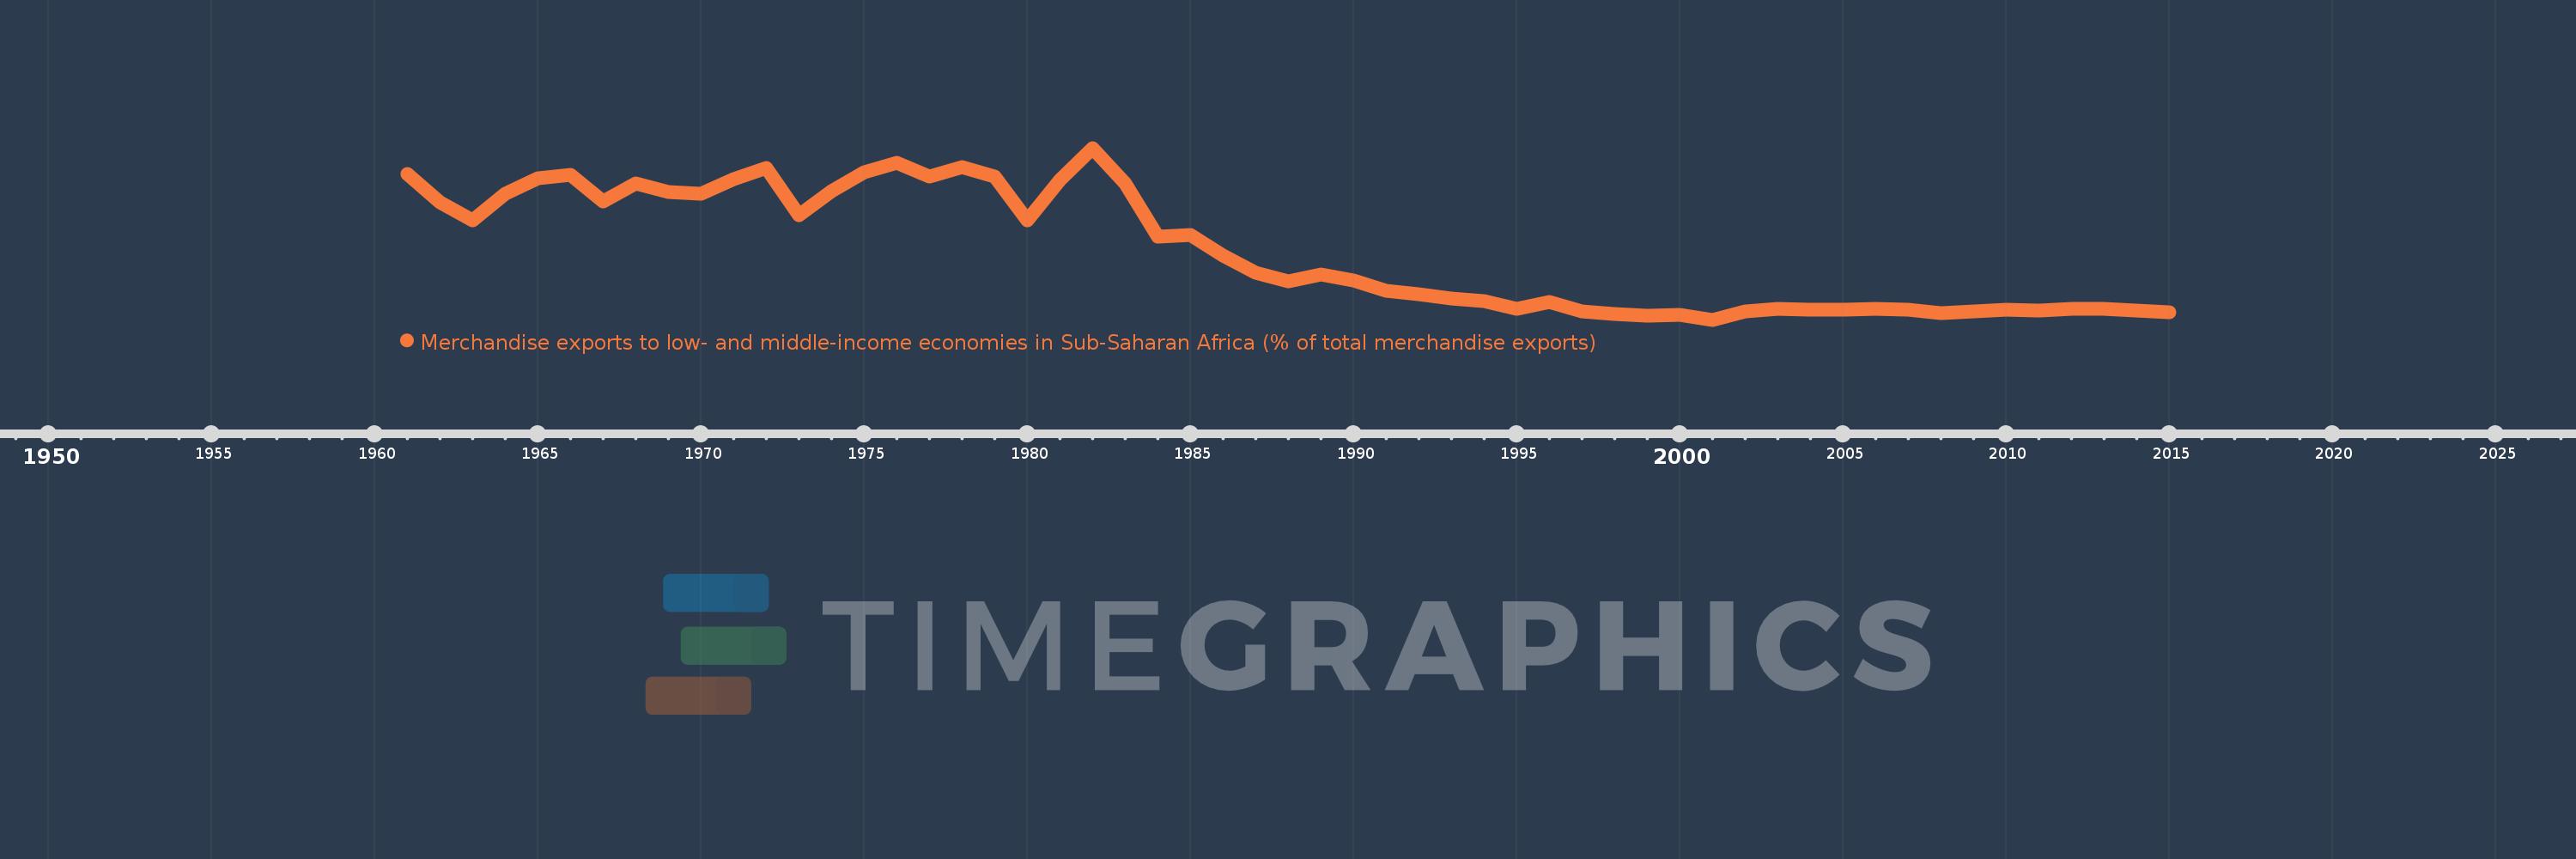
Merchandise exports to low- and middle-income economies in Sub-Saharan Africa (% of total merchandise exports)
2015,2014,2013,2012,2011,2010,2009,2008,2007,2006,2005,2004,2003,2002,2001,2000,1999,1998,1997,1996,1995,1994,1993,1992,1991,1990,1989,1988,1987,1986,1985,1984,1983,1982,1981,1980,1979,1978,1977,1976,1975,1974,1973,1972,1971,1970,1969,1968,1967,1966,1965,1964,1963,1962,1961
This statistics in other country:
AfghanistanAlbaniaAlgeriaAngolaArab WorldArgentinaArmeniaAustraliaAustriaAzerbaijanBahamas, TheBahrainBangladeshBarbadosBelarusBelgiumBelizeBeninBermudaBoliviaBrazilBulgariaBurkina FasoBurundiCabo VerdeCambodiaCameroonCanadaCaribbean small statesCentral African RepublicCentral Europe and the BalticsChadChileChinaColombiaCongo, Dem. Rep.Congo, Rep.Costa RicaCote d'IvoireCroatiaCubaCyprusCzech RepublicDenmarkDjiboutiDominicaDominican RepublicEarly-demographic dividendEast Asia & PacificEast Asia & Pacific (excluding high income)East Asia & Pacific (IDA & IBRD countries)EcuadorEgypt, Arab Rep.EstoniaEthiopiaEuro areaEurope & Central AsiaEurope & Central Asia (excluding high income)Europe & Central Asia (IDA & IBRD countries)European UnionFijiFinlandFragile and conflict affected situationsFranceGabonGambia, TheGeorgiaGermanyGhanaGibraltarGreeceGreenlandGuatemalaGuineaGuinea-BissauGuyanaHaitiHeavily indebted poor countries (HIPC)High incomeHondurasHong Kong SAR, ChinaHungaryIBRD onlyIcelandIDA & IBRD totalIDA blendIDA onlyIDA totalIndiaIndonesiaIran, Islamic Rep.IraqIrelandIsraelItalyJamaicaJapanJordanKazakhstanKenyaKorea, Dem. People’s Rep.Korea, Rep.KuwaitLao PDRLate-demographic dividendLatin America & Caribbean Latin America & Caribbean (excluding high income)Latin America & the Caribbean (IDA & IBRD countries)LatviaLeast developed countries: UN classificationLebanonLiberiaLibyaLithuaniaLow & middle incomeLow incomeLower middle incomeLuxembourgMacao SAR, ChinaMacedonia, FYRMadagascarMalawiMalaysiaMaliMaltaMauritaniaMauritiusMexicoMiddle East & North AfricaMiddle East & North Africa (excluding high income)Middle East & North Africa (IDA & IBRD countries)Middle incomeMoldovaMontenegroMoroccoMozambiqueMyanmarNetherlandsNew ZealandNicaraguaNigerNigeriaNorth AmericaNorwayOECD membersOmanOther small statesPacific island small statesPakistanPanamaPapua New GuineaParaguayPeruPhilippinesPolandPortugalPost-demographic dividendPre-demographic dividendQatarRomaniaRussian FederationRwandaSaudi ArabiaSenegalSerbiaSeychellesSierra LeoneSingaporeSlovak RepublicSloveniaSmall statesSomaliaSouth AfricaSouth AsiaSouth Asia (IDA & IBRD)SpainSri LankaSt. LuciaSt. Vincent and the GrenadinesSub-Saharan Africa Sub-Saharan Africa (excluding high income)Sub-Saharan Africa (IDA & IBRD countries)SudanSurinameSwedenSwitzerlandSyrian Arab RepublicTanzaniaThailandTogoTrinidad and TobagoTunisiaTurkeyUgandaUkraineUnited Arab EmiratesUnited KingdomUnited StatesUpper middle incomeUruguayVenezuela, RBVietnamWorldYemen, Rep.ZambiaZimbabwe Timeline:
This timeline shows a graph from 1961 to 2015 of Germany. No data until 1960. Number of actual observations by date: 55.
Source name:
World Development Indicators
Source organization:
World Bank staff estimates based data from International Monetary Fund's Direction of Trade database.
Categories, topics:
Private Sector, Trade
Last updated:
apr 23, 2017
Indicators value changes by year
At the date of observation
Value
Absolute change
Change from previous value
jan 1, 1961
3.277
+3.277
0.0%
jan 1, 1962
2.838
-0.439
-13.41%
jan 1, 1963
2.569
-0.269
-9.48%
jan 1, 1964
2.975
+0.406
15.82%
jan 1, 1965
3.221
+0.246
8.25%
jan 1, 1966
3.265
+0.044
1.37%
jan 1, 1967
2.859
-0.406
-12.43%
jan 1, 1968
3.135
+0.276
9.67%
jan 1, 1969
3.006
-0.13
-4.13%
jan 1, 1970
2.975
-0.031
-1.04%
jan 1, 1971
3.199
+0.224
7.55%
jan 1, 1972
3.38
+0.181
5.66%
jan 1, 1973
2.643
-0.737
-21.81%
jan 1, 1974
3.01
+0.368
13.91%
jan 1, 1975
3.305
+0.294
9.77%
jan 1, 1976
3.46
+0.155
4.69%
jan 1, 1977
3.25
-0.21
-6.07%
jan 1, 1978
3.392
+0.143
4.39%
jan 1, 1979
3.24
-0.152
-4.49%
jan 1, 1980
2.564
-0.676
-20.88%
jan 1, 1981
3.191
+0.628
24.48%
jan 1, 1982
3.688
+0.497
15.57%
jan 1, 1983
3.142
-0.546
-14.79%
jan 1, 1984
2.309
-0.833
-26.51%
jan 1, 1985
2.34
+0.031
1.33%
jan 1, 1986
2.016
-0.324
-13.84%
jan 1, 1987
1.744
-0.272
-13.48%
jan 1, 1988
1.61
-0.134
-7.67%
jan 1, 1989
1.72
+0.109
6.79%
jan 1, 1990
1.622
-0.098
-5.68%
jan 1, 1991
1.463
-0.16
-9.84%
jan 1, 1992
1.411
-0.051
-3.49%
jan 1, 1993
1.351
-0.06
-4.26%
jan 1, 1994
1.303
-0.048
-3.59%
jan 1, 1995
1.191
-0.112
-8.62%
jan 1, 1996
1.291
+0.1
8.42%
jan 1, 1997
1.145
-0.146
-11.3%
jan 1, 1998
1.101
-0.044
-3.86%
jan 1, 1999
1.075
-0.026
-2.34%
jan 1, 2000
1.092
+0.017
1.6%
jan 1, 2001
1.018
-0.074
-6.81%
jan 1, 2002
1.151
+0.133
13.11%
jan 1, 2003
1.182
+0.031
2.68%
jan 1, 2004
1.172
-0.01
-0.86%
jan 1, 2005
1.17
-0.002
-0.14%
jan 1, 2006
1.192
+0.021
1.84%
jan 1, 2007
1.168
-0.024
-2.01%
jan 1, 2008
1.126
-0.042
-3.57%
jan 1, 2009
1.145
+0.019
1.67%
jan 1, 2010
1.173
+0.028
2.48%
jan 1, 2011
1.162
-0.011
-0.97%
jan 1, 2012
1.192
+0.03
2.57%
jan 1, 2013
1.19
-0.002
-0.18%
jan 1, 2014
1.163
-0.027
-2.25%
jan 1, 2015
1.128
-0.035
-3.0%
Ranking of countries by current statistics by years


Comments: