29
/
en
AIzaSyAYiBZKx7MnpbEhh9jyipgxe19OcubqV5w
April 1, 2024
170202
Korea, Rep.
KOR
true
2
1
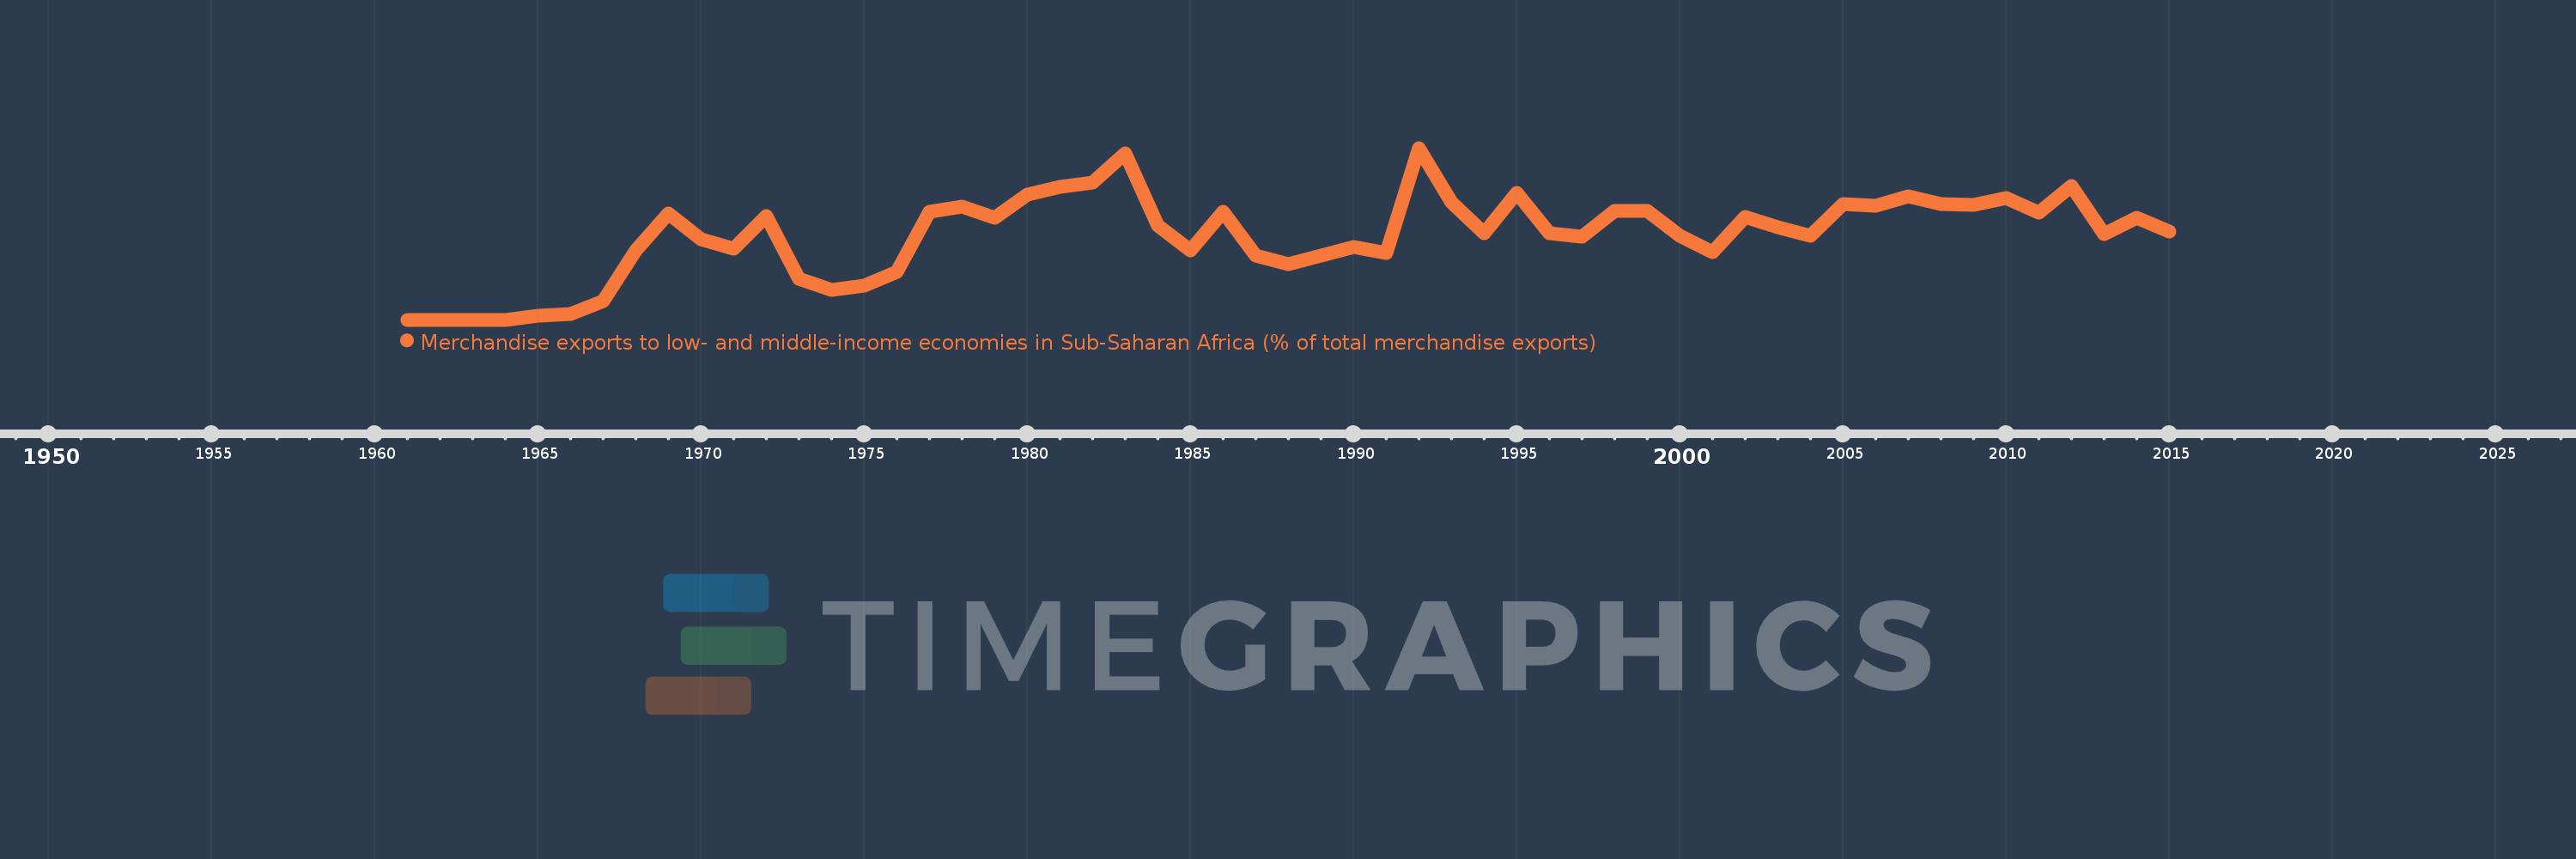
Merchandise exports to low- and middle-income economies in Sub-Saharan Africa (% of total merchandise exports)
2015,2014,2013,2012,2011,2010,2009,2008,2007,2006,2005,2004,2003,2002,2001,2000,1999,1998,1997,1996,1995,1994,1993,1992,1991,1990,1989,1988,1987,1986,1985,1984,1983,1982,1981,1980,1979,1978,1977,1976,1975,1974,1973,1972,1971,1970,1969,1968,1967,1966,1965,1964,1963,1962,1961
This statistics in other country:
AfghanistanAlbaniaAlgeriaAngolaArab WorldArgentinaArmeniaAustraliaAustriaAzerbaijanBahamas, TheBahrainBangladeshBarbadosBelarusBelgiumBelizeBeninBermudaBoliviaBrazilBulgariaBurkina FasoBurundiCabo VerdeCambodiaCameroonCanadaCaribbean small statesCentral African RepublicCentral Europe and the BalticsChadChileChinaColombiaCongo, Dem. Rep.Congo, Rep.Costa RicaCote d'IvoireCroatiaCubaCyprusCzech RepublicDenmarkDjiboutiDominicaDominican RepublicEarly-demographic dividendEast Asia & PacificEast Asia & Pacific (excluding high income)East Asia & Pacific (IDA & IBRD countries)EcuadorEgypt, Arab Rep.EstoniaEthiopiaEuro areaEurope & Central AsiaEurope & Central Asia (excluding high income)Europe & Central Asia (IDA & IBRD countries)European UnionFijiFinlandFragile and conflict affected situationsFranceGabonGambia, TheGeorgiaGermanyGhanaGibraltarGreeceGreenlandGuatemalaGuineaGuinea-BissauGuyanaHaitiHeavily indebted poor countries (HIPC)High incomeHondurasHong Kong SAR, ChinaHungaryIBRD onlyIcelandIDA & IBRD totalIDA blendIDA onlyIDA totalIndiaIndonesiaIran, Islamic Rep.IraqIrelandIsraelItalyJamaicaJapanJordanKazakhstanKenyaKorea, Dem. People’s Rep.Korea, Rep.KuwaitLao PDRLate-demographic dividendLatin America & Caribbean Latin America & Caribbean (excluding high income)Latin America & the Caribbean (IDA & IBRD countries)LatviaLeast developed countries: UN classificationLebanonLiberiaLibyaLithuaniaLow & middle incomeLow incomeLower middle incomeLuxembourgMacao SAR, ChinaMacedonia, FYRMadagascarMalawiMalaysiaMaliMaltaMauritaniaMauritiusMexicoMiddle East & North AfricaMiddle East & North Africa (excluding high income)Middle East & North Africa (IDA & IBRD countries)Middle incomeMoldovaMontenegroMoroccoMozambiqueMyanmarNetherlandsNew ZealandNicaraguaNigerNigeriaNorth AmericaNorwayOECD membersOmanOther small statesPacific island small statesPakistanPanamaPapua New GuineaParaguayPeruPhilippinesPolandPortugalPost-demographic dividendPre-demographic dividendQatarRomaniaRussian FederationRwandaSaudi ArabiaSenegalSerbiaSeychellesSierra LeoneSingaporeSlovak RepublicSloveniaSmall statesSomaliaSouth AfricaSouth AsiaSouth Asia (IDA & IBRD)SpainSri LankaSt. LuciaSt. Vincent and the GrenadinesSub-Saharan Africa Sub-Saharan Africa (excluding high income)Sub-Saharan Africa (IDA & IBRD countries)SudanSurinameSwedenSwitzerlandSyrian Arab RepublicTanzaniaThailandTogoTrinidad and TobagoTunisiaTurkeyUgandaUkraineUnited Arab EmiratesUnited KingdomUnited StatesUpper middle incomeUruguayVenezuela, RBVietnamWorldYemen, Rep.ZambiaZimbabwe Timeline:
This timeline shows a graph from 1961 to 2015 of Korea, Rep.. No data until 1960. Number of actual observations by date: 55.
Source name:
World Development Indicators
Source organization:
World Bank staff estimates based data from International Monetary Fund's Direction of Trade database.
Categories, topics:
Private Sector, Trade
Last updated:
apr 23, 2017
Indicators value changes by year
At the date of observation
Value
Absolute change
Change from previous value
jan 1, 1965
0.086
+0.086
%
jan 1, 1966
0.117
+0.031
35.82%
jan 1, 1967
0.361
+0.245
209.63%
jan 1, 1968
1.346
+0.985
272.62%
jan 1, 1969
2.066
+0.72
53.49%
jan 1, 1970
1.558
-0.508
-24.6%
jan 1, 1971
1.39
-0.168
-10.81%
jan 1, 1972
2.021
+0.632
45.46%
jan 1, 1973
0.792
-1.229
-60.81%
jan 1, 1974
0.576
-0.216
-27.25%
jan 1, 1975
0.663
+0.086
15.0%
jan 1, 1976
0.934
+0.272
40.99%
jan 1, 1977
2.099
+1.164
124.62%
jan 1, 1978
2.195
+0.097
4.61%
jan 1, 1979
1.991
-0.205
-9.32%
jan 1, 1980
2.433
+0.442
22.21%
jan 1, 1981
2.594
+0.161
6.61%
jan 1, 1982
2.662
+0.068
2.63%
jan 1, 1983
3.236
+0.574
21.56%
jan 1, 1984
1.828
-1.408
-43.52%
jan 1, 1985
1.356
-0.471
-25.79%
jan 1, 1986
2.104
+0.748
55.14%
jan 1, 1987
1.249
-0.854
-40.61%
jan 1, 1988
1.077
-0.172
-13.77%
jan 1, 1989
1.249
+0.172
15.95%
jan 1, 1990
1.423
+0.173
13.88%
jan 1, 1991
1.303
-0.12
-8.44%
jan 1, 1992
3.343
+2.041
156.65%
jan 1, 1993
2.289
-1.054
-31.53%
jan 1, 1994
1.684
-0.606
-26.45%
jan 1, 1995
2.467
+0.784
46.54%
jan 1, 1996
1.687
-0.781
-31.64%
jan 1, 1997
1.624
-0.062
-3.69%
jan 1, 1998
2.116
+0.491
30.25%
jan 1, 1999
2.122
+0.006
0.29%
jan 1, 2000
1.629
-0.493
-23.21%
jan 1, 2001
1.309
-0.32
-19.64%
jan 1, 2002
1.999
+0.69
52.68%
jan 1, 2003
1.797
-0.202
-10.1%
jan 1, 2004
1.639
-0.158
-8.77%
jan 1, 2005
2.244
+0.604
36.85%
jan 1, 2006
2.219
-0.024
-1.08%
jan 1, 2007
2.406
+0.187
8.4%
jan 1, 2008
2.258
-0.148
-6.15%
jan 1, 2009
2.239
-0.019
-0.84%
jan 1, 2010
2.366
+0.127
5.69%
jan 1, 2011
2.083
-0.283
-11.96%
jan 1, 2012
2.599
+0.516
24.75%
jan 1, 2013
1.663
-0.936
-36.02%
jan 1, 2014
1.986
+0.323
19.44%
jan 1, 2015
1.72
-0.266
-13.4%
Ranking of countries by current statistics by years


Comments: