29
/
en
AIzaSyAYiBZKx7MnpbEhh9jyipgxe19OcubqV5w
April 1, 2024
25085
Caribbean small states
CSS
false
2
1
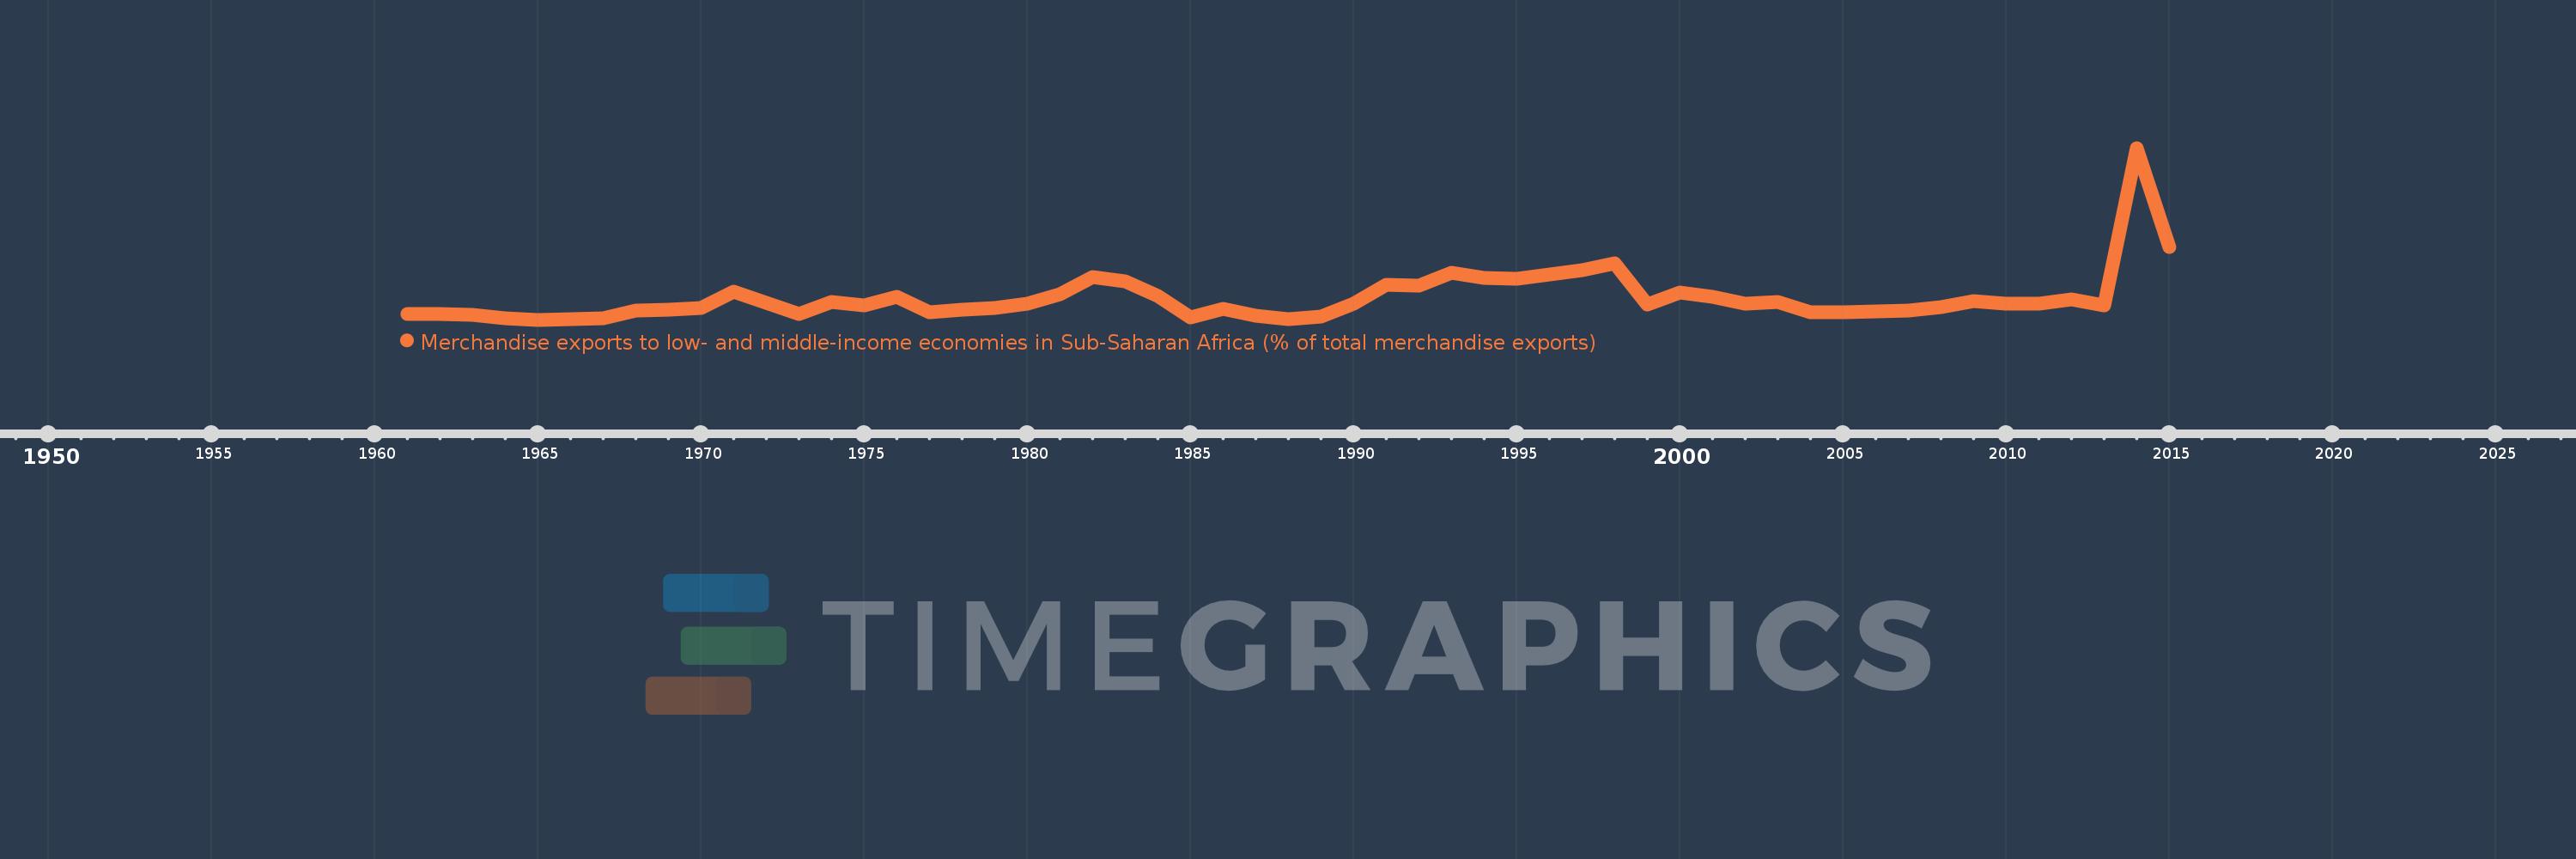
Merchandise exports to low- and middle-income economies in Sub-Saharan Africa (% of total merchandise exports)
2015,2014,2013,2012,2011,2010,2009,2008,2007,2006,2005,2004,2003,2002,2001,2000,1999,1998,1997,1996,1995,1994,1993,1992,1991,1990,1989,1988,1987,1986,1985,1984,1983,1982,1981,1980,1979,1978,1977,1976,1975,1974,1973,1972,1971,1970,1969,1968,1967,1966,1965,1964,1963,1962,1961
This statistics in other country:
AfghanistanAlbaniaAlgeriaAngolaArab WorldArgentinaArmeniaAustraliaAustriaAzerbaijanBahamas, TheBahrainBangladeshBarbadosBelarusBelgiumBelizeBeninBermudaBoliviaBrazilBulgariaBurkina FasoBurundiCabo VerdeCambodiaCameroonCanadaCaribbean small statesCentral African RepublicCentral Europe and the BalticsChadChileChinaColombiaCongo, Dem. Rep.Congo, Rep.Costa RicaCote d'IvoireCroatiaCubaCyprusCzech RepublicDenmarkDjiboutiDominicaDominican RepublicEarly-demographic dividendEast Asia & PacificEast Asia & Pacific (excluding high income)East Asia & Pacific (IDA & IBRD countries)EcuadorEgypt, Arab Rep.EstoniaEthiopiaEuro areaEurope & Central AsiaEurope & Central Asia (excluding high income)Europe & Central Asia (IDA & IBRD countries)European UnionFijiFinlandFragile and conflict affected situationsFranceGabonGambia, TheGeorgiaGermanyGhanaGibraltarGreeceGreenlandGuatemalaGuineaGuinea-BissauGuyanaHaitiHeavily indebted poor countries (HIPC)High incomeHondurasHong Kong SAR, ChinaHungaryIBRD onlyIcelandIDA & IBRD totalIDA blendIDA onlyIDA totalIndiaIndonesiaIran, Islamic Rep.IraqIrelandIsraelItalyJamaicaJapanJordanKazakhstanKenyaKorea, Dem. People’s Rep.Korea, Rep.KuwaitLao PDRLate-demographic dividendLatin America & Caribbean Latin America & Caribbean (excluding high income)Latin America & the Caribbean (IDA & IBRD countries)LatviaLeast developed countries: UN classificationLebanonLiberiaLibyaLithuaniaLow & middle incomeLow incomeLower middle incomeLuxembourgMacao SAR, ChinaMacedonia, FYRMadagascarMalawiMalaysiaMaliMaltaMauritaniaMauritiusMexicoMiddle East & North AfricaMiddle East & North Africa (excluding high income)Middle East & North Africa (IDA & IBRD countries)Middle incomeMoldovaMontenegroMoroccoMozambiqueMyanmarNetherlandsNew ZealandNicaraguaNigerNigeriaNorth AmericaNorwayOECD membersOmanOther small statesPacific island small statesPakistanPanamaPapua New GuineaParaguayPeruPhilippinesPolandPortugalPost-demographic dividendPre-demographic dividendQatarRomaniaRussian FederationRwandaSaudi ArabiaSenegalSerbiaSeychellesSierra LeoneSingaporeSlovak RepublicSloveniaSmall statesSomaliaSouth AfricaSouth AsiaSouth Asia (IDA & IBRD)SpainSri LankaSt. LuciaSt. Vincent and the GrenadinesSub-Saharan Africa Sub-Saharan Africa (excluding high income)Sub-Saharan Africa (IDA & IBRD countries)SudanSurinameSwedenSwitzerlandSyrian Arab RepublicTanzaniaThailandTogoTrinidad and TobagoTunisiaTurkeyUgandaUkraineUnited Arab EmiratesUnited KingdomUnited StatesUpper middle incomeUruguayVenezuela, RBVietnamWorldYemen, Rep.ZambiaZimbabwe Timeline:
This timeline shows a graph from 1961 to 2015 of Caribbean small states. No data until 1960. Number of actual observations by date: 55.
Source name:
World Development Indicators
Source organization:
World Bank staff estimates based data from International Monetary Fund's Direction of Trade database.
Categories, topics:
Private Sector, Trade
Last updated:
apr 23, 2017
Indicators value changes by year
At the date of observation
Value
Absolute change
Change from previous value
jan 1, 1961
0.177
+0.177
0.0%
jan 1, 1962
0.164
-0.013
-7.6%
jan 1, 1963
0.142
-0.021
-13.05%
jan 1, 1964
0.044
-0.099
-69.27%
jan 1, 1965
0.0
-0.044
-100.0%
jan 1, 1966
0.012
+0.012
%
jan 1, 1967
0.033
+0.021
173.54%
jan 1, 1968
0.281
+0.248
752.78%
jan 1, 1969
0.3
+0.019
6.62%
jan 1, 1970
0.345
+0.045
15.1%
jan 1, 1971
0.857
+0.512
148.54%
jan 1, 1972
0.5
-0.358
-41.72%
jan 1, 1973
0.164
-0.336
-67.21%
jan 1, 1974
0.537
+0.374
228.03%
jan 1, 1975
0.444
-0.094
-17.45%
jan 1, 1976
0.699
+0.255
57.58%
jan 1, 1977
0.215
-0.484
-69.24%
jan 1, 1978
0.3
+0.085
39.66%
jan 1, 1979
0.353
+0.053
17.6%
jan 1, 1980
0.476
+0.123
34.73%
jan 1, 1981
0.776
+0.3
63.1%
jan 1, 1982
1.289
+0.513
66.11%
jan 1, 1983
1.172
-0.117
-9.09%
jan 1, 1984
0.731
-0.441
-37.65%
jan 1, 1985
0.076
-0.655
-89.58%
jan 1, 1986
0.323
+0.247
324.68%
jan 1, 1987
0.121
-0.202
-62.48%
jan 1, 1988
0.021
-0.1
-82.48%
jan 1, 1989
0.089
+0.068
320.06%
jan 1, 1990
0.481
+0.391
438.27%
jan 1, 1991
1.065
+0.584
121.51%
jan 1, 1992
1.024
-0.041
-3.82%
jan 1, 1993
1.428
+0.404
39.44%
jan 1, 1994
1.279
-0.148
-10.39%
jan 1, 1995
1.252
-0.027
-2.14%
jan 1, 1996
1.368
+0.116
9.28%
jan 1, 1997
1.507
+0.138
10.11%
jan 1, 1998
1.718
+0.212
14.04%
jan 1, 1999
0.469
-1.249
-72.72%
jan 1, 2000
0.831
+0.363
77.35%
jan 1, 2001
0.695
-0.136
-16.38%
jan 1, 2002
0.474
-0.221
-31.75%
jan 1, 2003
0.533
+0.059
12.34%
jan 1, 2004
0.222
-0.311
-58.4%
jan 1, 2005
0.229
+0.007
3.27%
jan 1, 2006
0.259
+0.03
13.17%
jan 1, 2007
0.288
+0.029
11.01%
jan 1, 2008
0.374
+0.086
29.96%
jan 1, 2009
0.555
+0.181
48.5%
jan 1, 2010
0.486
-0.07
-12.54%
jan 1, 2011
0.476
-0.01
-2.04%
jan 1, 2012
0.609
+0.133
27.98%
jan 1, 2013
0.424
-0.184
-30.3%
jan 1, 2014
5.201
+4.777
1.13K%
jan 1, 2015
2.203
-2.998
-57.64%
Ranking of countries by current statistics by years


Comments: