29
/
en
AIzaSyAYiBZKx7MnpbEhh9jyipgxe19OcubqV5w
April 1, 2024
191648
Malta
MLT
true
2
1
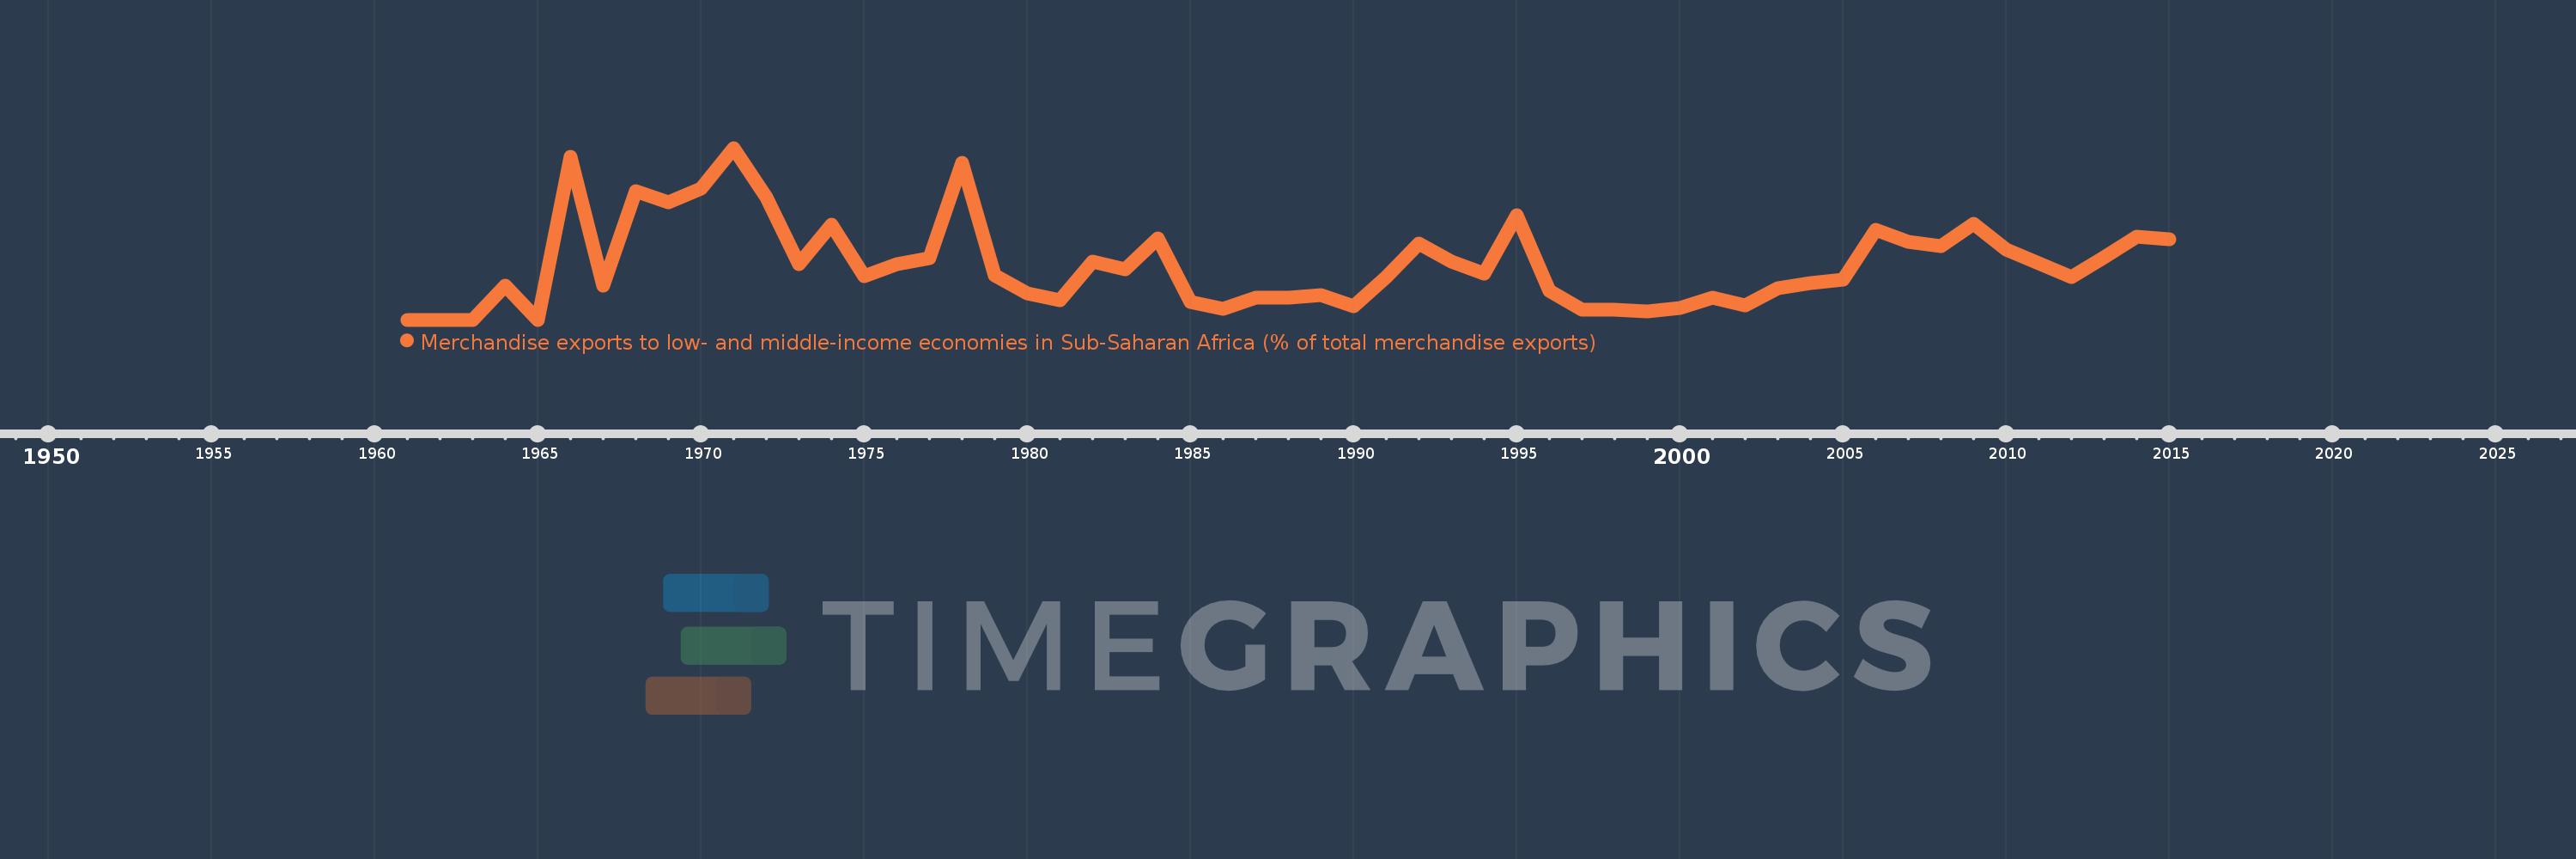
Merchandise exports to low- and middle-income economies in Sub-Saharan Africa (% of total merchandise exports)
2015,2014,2013,2012,2011,2010,2009,2008,2007,2006,2005,2004,2003,2002,2001,2000,1999,1998,1997,1996,1995,1994,1993,1992,1991,1990,1989,1988,1987,1986,1985,1984,1983,1982,1981,1980,1979,1978,1977,1976,1975,1974,1973,1972,1971,1970,1969,1968,1967,1966,1965,1964,1963,1962,1961
This statistics in other country:
AfghanistanAlbaniaAlgeriaAngolaArab WorldArgentinaArmeniaAustraliaAustriaAzerbaijanBahamas, TheBahrainBangladeshBarbadosBelarusBelgiumBelizeBeninBermudaBoliviaBrazilBulgariaBurkina FasoBurundiCabo VerdeCambodiaCameroonCanadaCaribbean small statesCentral African RepublicCentral Europe and the BalticsChadChileChinaColombiaCongo, Dem. Rep.Congo, Rep.Costa RicaCote d'IvoireCroatiaCubaCyprusCzech RepublicDenmarkDjiboutiDominicaDominican RepublicEarly-demographic dividendEast Asia & PacificEast Asia & Pacific (excluding high income)East Asia & Pacific (IDA & IBRD countries)EcuadorEgypt, Arab Rep.EstoniaEthiopiaEuro areaEurope & Central AsiaEurope & Central Asia (excluding high income)Europe & Central Asia (IDA & IBRD countries)European UnionFijiFinlandFragile and conflict affected situationsFranceGabonGambia, TheGeorgiaGermanyGhanaGibraltarGreeceGreenlandGuatemalaGuineaGuinea-BissauGuyanaHaitiHeavily indebted poor countries (HIPC)High incomeHondurasHong Kong SAR, ChinaHungaryIBRD onlyIcelandIDA & IBRD totalIDA blendIDA onlyIDA totalIndiaIndonesiaIran, Islamic Rep.IraqIrelandIsraelItalyJamaicaJapanJordanKazakhstanKenyaKorea, Dem. People’s Rep.Korea, Rep.KuwaitLao PDRLate-demographic dividendLatin America & Caribbean Latin America & Caribbean (excluding high income)Latin America & the Caribbean (IDA & IBRD countries)LatviaLeast developed countries: UN classificationLebanonLiberiaLibyaLithuaniaLow & middle incomeLow incomeLower middle incomeLuxembourgMacao SAR, ChinaMacedonia, FYRMadagascarMalawiMalaysiaMaliMaltaMauritaniaMauritiusMexicoMiddle East & North AfricaMiddle East & North Africa (excluding high income)Middle East & North Africa (IDA & IBRD countries)Middle incomeMoldovaMontenegroMoroccoMozambiqueMyanmarNetherlandsNew ZealandNicaraguaNigerNigeriaNorth AmericaNorwayOECD membersOmanOther small statesPacific island small statesPakistanPanamaPapua New GuineaParaguayPeruPhilippinesPolandPortugalPost-demographic dividendPre-demographic dividendQatarRomaniaRussian FederationRwandaSaudi ArabiaSenegalSerbiaSeychellesSierra LeoneSingaporeSlovak RepublicSloveniaSmall statesSomaliaSouth AfricaSouth AsiaSouth Asia (IDA & IBRD)SpainSri LankaSt. LuciaSt. Vincent and the GrenadinesSub-Saharan Africa Sub-Saharan Africa (excluding high income)Sub-Saharan Africa (IDA & IBRD countries)SudanSurinameSwedenSwitzerlandSyrian Arab RepublicTanzaniaThailandTogoTrinidad and TobagoTunisiaTurkeyUgandaUkraineUnited Arab EmiratesUnited KingdomUnited StatesUpper middle incomeUruguayVenezuela, RBVietnamWorldYemen, Rep.ZambiaZimbabwe Timeline:
This timeline shows a graph from 1961 to 2015 of Malta. No data until 1960. Number of actual observations by date: 55.
Source name:
World Development Indicators
Source organization:
World Bank staff estimates based data from International Monetary Fund's Direction of Trade database.
Categories, topics:
Private Sector, Trade
Last updated:
apr 23, 2017
Indicators value changes by year
At the date of observation
Value
Absolute change
Change from previous value
jan 1, 1964
0.714
+0.714
%
jan 1, 1965
0.0
-0.714
-100.0%
jan 1, 1967
0.702
-2.688
-79.3%
jan 1, 1968
2.689
+1.987
283.15%
jan 1, 1969
2.439
-0.25
-9.29%
jan 1, 1970
2.743
+0.304
12.46%
jan 1, 1971
3.581
+0.838
30.54%
jan 1, 1972
2.549
-1.031
-28.8%
jan 1, 1973
1.161
-1.388
-54.44%
jan 1, 1974
1.99
+0.829
71.38%
jan 1, 1975
0.911
-1.08
-54.24%
jan 1, 1976
1.157
+0.246
26.98%
jan 1, 1977
1.284
+0.128
11.05%
jan 1, 1978
3.263
+1.979
154.07%
jan 1, 1979
0.929
-2.335
-71.54%
jan 1, 1980
0.549
-0.379
-40.86%
jan 1, 1981
0.412
-0.137
-25.02%
jan 1, 1982
1.21
+0.798
193.87%
jan 1, 1983
1.059
-0.152
-12.52%
jan 1, 1984
1.701
+0.642
60.68%
jan 1, 1985
0.363
-1.338
-78.69%
jan 1, 1986
0.228
-0.135
-37.14%
jan 1, 1987
0.466
+0.238
104.28%
jan 1, 1988
0.458
-0.007
-1.59%
jan 1, 1989
0.513
+0.055
12.01%
jan 1, 1990
0.277
-0.237
-46.11%
jan 1, 1991
0.888
+0.612
221.27%
jan 1, 1992
1.591
+0.702
79.03%
jan 1, 1993
1.214
-0.377
-23.68%
jan 1, 1994
0.955
-0.259
-21.36%
jan 1, 1995
2.175
+1.22
127.83%
jan 1, 1996
0.61
-1.565
-71.96%
jan 1, 1997
0.213
-0.397
-65.07%
jan 1, 1998
0.209
-0.004
-1.99%
jan 1, 1999
0.178
-0.031
-14.83%
jan 1, 2000
0.239
+0.061
34.1%
jan 1, 2001
0.463
+0.224
94.1%
jan 1, 2002
0.292
-0.171
-36.98%
jan 1, 2003
0.658
+0.366
125.48%
jan 1, 2004
0.772
+0.114
17.3%
jan 1, 2005
0.84
+0.069
8.9%
jan 1, 2006
1.867
+1.027
122.22%
jan 1, 2007
1.622
-0.245
-13.14%
jan 1, 2008
1.542
-0.08
-4.92%
jan 1, 2009
2.001
+0.459
29.75%
jan 1, 2010
1.467
-0.534
-26.69%
jan 1, 2011
1.179
-0.287
-19.6%
jan 1, 2012
0.891
-0.288
-24.4%
jan 1, 2013
1.31
+0.418
46.92%
jan 1, 2014
1.736
+0.426
32.54%
jan 1, 2015
1.674
-0.062
-3.55%
Ranking of countries by current statistics by years


Comments: