29
/
en
AIzaSyAYiBZKx7MnpbEhh9jyipgxe19OcubqV5w
April 1, 2024
70100
Argentina
ARG
true
2
1
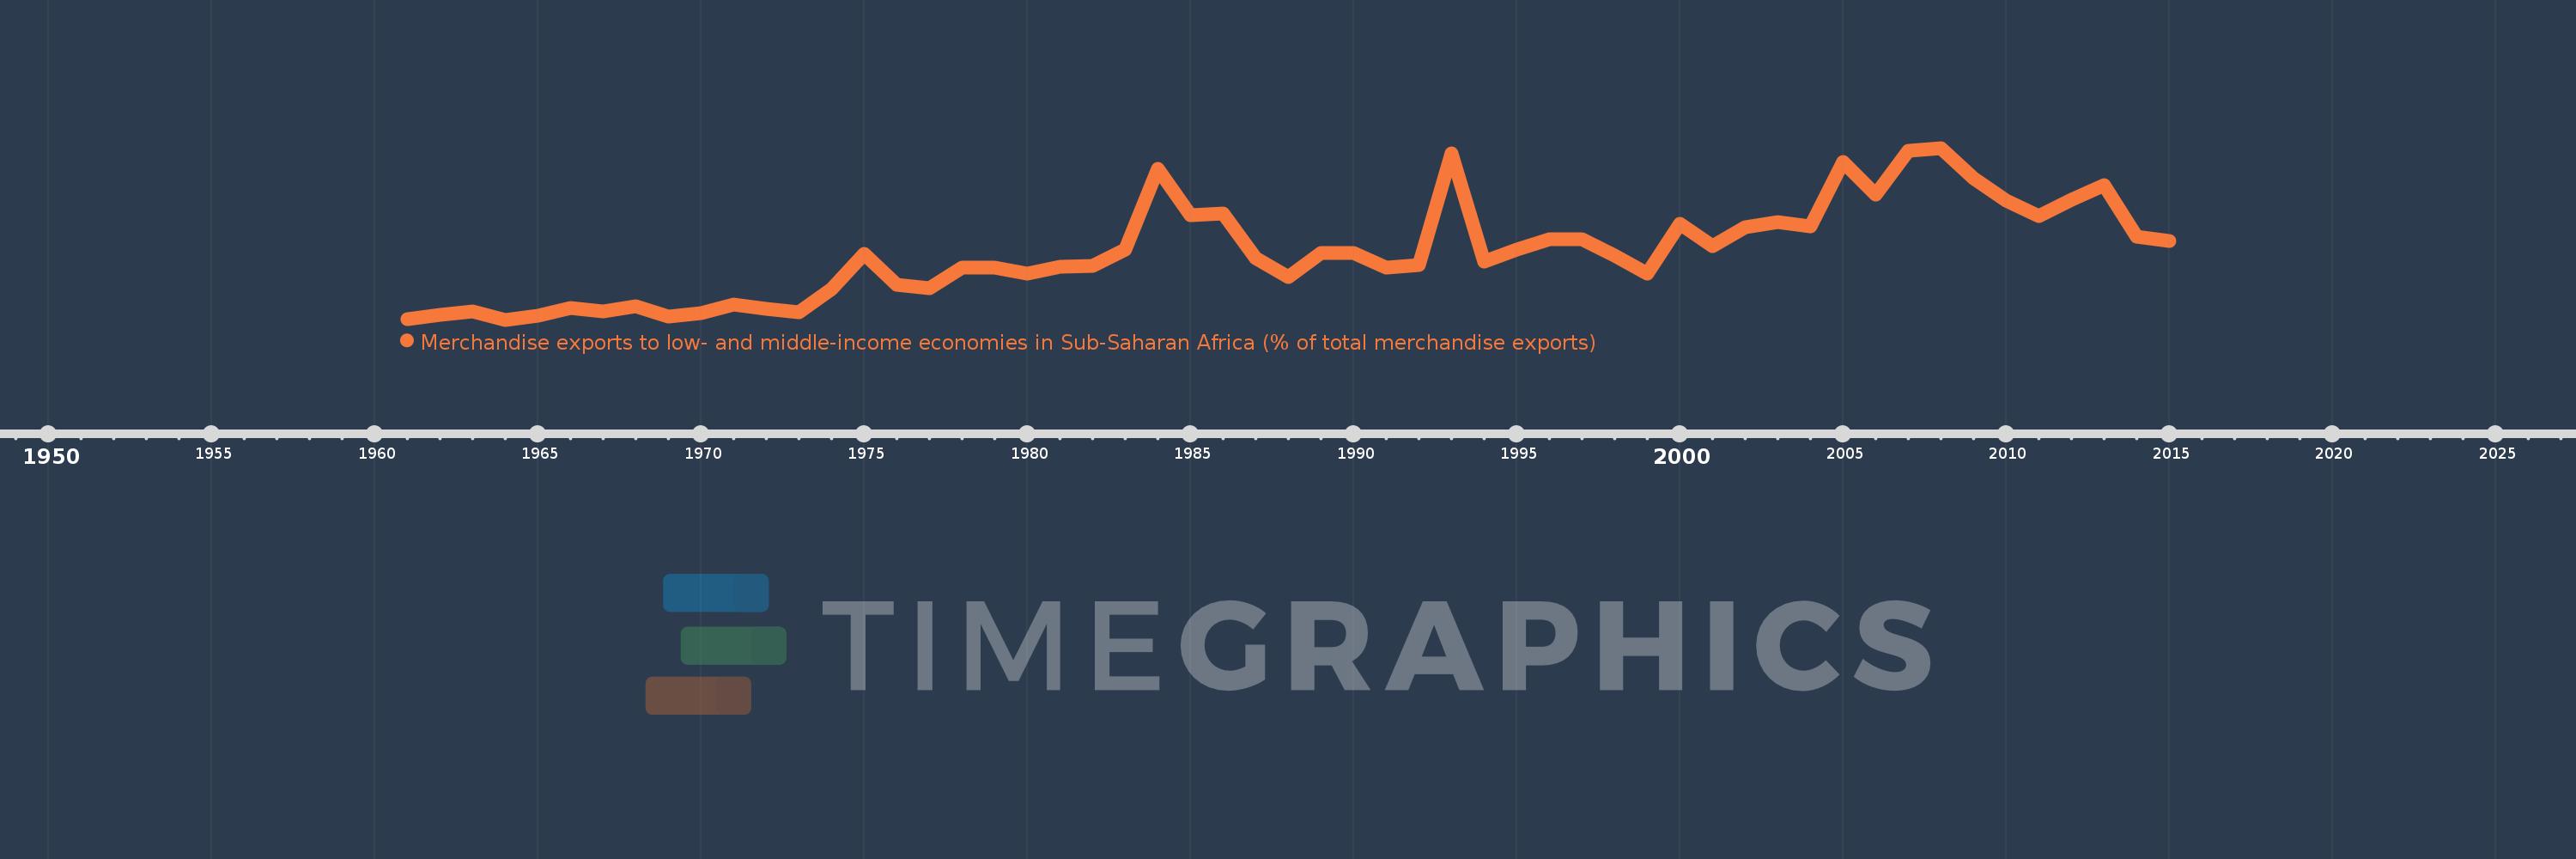
Merchandise exports to low- and middle-income economies in Sub-Saharan Africa (% of total merchandise exports)
2015,2014,2013,2012,2011,2010,2009,2008,2007,2006,2005,2004,2003,2002,2001,2000,1999,1998,1997,1996,1995,1994,1993,1992,1991,1990,1989,1988,1987,1986,1985,1984,1983,1982,1981,1980,1979,1978,1977,1976,1975,1974,1973,1972,1971,1970,1969,1968,1967,1966,1965,1964,1963,1962,1961
This statistics in other country:
AfghanistanAlbaniaAlgeriaAngolaArab WorldArgentinaArmeniaAustraliaAustriaAzerbaijanBahamas, TheBahrainBangladeshBarbadosBelarusBelgiumBelizeBeninBermudaBoliviaBrazilBulgariaBurkina FasoBurundiCabo VerdeCambodiaCameroonCanadaCaribbean small statesCentral African RepublicCentral Europe and the BalticsChadChileChinaColombiaCongo, Dem. Rep.Congo, Rep.Costa RicaCote d'IvoireCroatiaCubaCyprusCzech RepublicDenmarkDjiboutiDominicaDominican RepublicEarly-demographic dividendEast Asia & PacificEast Asia & Pacific (excluding high income)East Asia & Pacific (IDA & IBRD countries)EcuadorEgypt, Arab Rep.EstoniaEthiopiaEuro areaEurope & Central AsiaEurope & Central Asia (excluding high income)Europe & Central Asia (IDA & IBRD countries)European UnionFijiFinlandFragile and conflict affected situationsFranceGabonGambia, TheGeorgiaGermanyGhanaGibraltarGreeceGreenlandGuatemalaGuineaGuinea-BissauGuyanaHaitiHeavily indebted poor countries (HIPC)High incomeHondurasHong Kong SAR, ChinaHungaryIBRD onlyIcelandIDA & IBRD totalIDA blendIDA onlyIDA totalIndiaIndonesiaIran, Islamic Rep.IraqIrelandIsraelItalyJamaicaJapanJordanKazakhstanKenyaKorea, Dem. People’s Rep.Korea, Rep.KuwaitLao PDRLate-demographic dividendLatin America & Caribbean Latin America & Caribbean (excluding high income)Latin America & the Caribbean (IDA & IBRD countries)LatviaLeast developed countries: UN classificationLebanonLiberiaLibyaLithuaniaLow & middle incomeLow incomeLower middle incomeLuxembourgMacao SAR, ChinaMacedonia, FYRMadagascarMalawiMalaysiaMaliMaltaMauritaniaMauritiusMexicoMiddle East & North AfricaMiddle East & North Africa (excluding high income)Middle East & North Africa (IDA & IBRD countries)Middle incomeMoldovaMontenegroMoroccoMozambiqueMyanmarNetherlandsNew ZealandNicaraguaNigerNigeriaNorth AmericaNorwayOECD membersOmanOther small statesPacific island small statesPakistanPanamaPapua New GuineaParaguayPeruPhilippinesPolandPortugalPost-demographic dividendPre-demographic dividendQatarRomaniaRussian FederationRwandaSaudi ArabiaSenegalSerbiaSeychellesSierra LeoneSingaporeSlovak RepublicSloveniaSmall statesSomaliaSouth AfricaSouth AsiaSouth Asia (IDA & IBRD)SpainSri LankaSt. LuciaSt. Vincent and the GrenadinesSub-Saharan Africa Sub-Saharan Africa (excluding high income)Sub-Saharan Africa (IDA & IBRD countries)SudanSurinameSwedenSwitzerlandSyrian Arab RepublicTanzaniaThailandTogoTrinidad and TobagoTunisiaTurkeyUgandaUkraineUnited Arab EmiratesUnited KingdomUnited StatesUpper middle incomeUruguayVenezuela, RBVietnamWorldYemen, Rep.ZambiaZimbabwe Timeline:
This timeline shows a graph from 1961 to 2015 of Argentina. No data until 1960. Number of actual observations by date: 55.
Source name:
World Development Indicators
Source organization:
World Bank staff estimates based data from International Monetary Fund's Direction of Trade database.
Categories, topics:
Private Sector, Trade
Last updated:
apr 23, 2017
Indicators value changes by year
At the date of observation
Value
Absolute change
Change from previous value
jan 1, 1961
0.185
+0.185
0.0%
jan 1, 1962
0.259
+0.074
39.9%
jan 1, 1963
0.337
+0.078
29.95%
jan 1, 1964
0.169
-0.168
-49.97%
jan 1, 1965
0.241
+0.073
43.12%
jan 1, 1966
0.395
+0.154
63.9%
jan 1, 1967
0.339
-0.056
-14.28%
jan 1, 1968
0.43
+0.091
26.89%
jan 1, 1969
0.234
-0.196
-45.53%
jan 1, 1970
0.304
+0.07
29.78%
jan 1, 1971
0.471
+0.167
54.89%
jan 1, 1972
0.391
-0.08
-17.04%
jan 1, 1973
0.319
-0.071
-18.24%
jan 1, 1974
0.777
+0.458
143.27%
jan 1, 1975
1.467
+0.69
88.77%
jan 1, 1976
0.855
-0.612
-41.71%
jan 1, 1977
0.789
-0.066
-7.69%
jan 1, 1978
1.196
+0.407
51.5%
jan 1, 1979
1.19
-0.006
-0.53%
jan 1, 1980
1.065
-0.125
-10.49%
jan 1, 1981
1.207
+0.142
13.33%
jan 1, 1982
1.224
+0.017
1.42%
jan 1, 1983
1.536
+0.313
25.54%
jan 1, 1984
3.122
+1.586
103.25%
jan 1, 1985
2.224
-0.899
-28.78%
jan 1, 1986
2.258
+0.034
1.55%
jan 1, 1987
1.369
-0.889
-39.37%
jan 1, 1988
0.999
-0.37
-27.03%
jan 1, 1989
1.483
+0.484
48.45%
jan 1, 1990
1.471
-0.013
-0.85%
jan 1, 1991
1.195
-0.276
-18.74%
jan 1, 1992
1.245
+0.05
4.17%
jan 1, 1993
3.422
+2.178
174.93%
jan 1, 1994
1.302
-2.12
-61.96%
jan 1, 1995
1.549
+0.247
19.0%
jan 1, 1996
1.739
+0.19
12.27%
jan 1, 1997
1.749
+0.01
0.55%
jan 1, 1998
1.421
-0.328
-18.78%
jan 1, 1999
1.07
-0.35
-24.65%
jan 1, 2000
2.051
+0.981
91.65%
jan 1, 2001
1.606
-0.446
-21.74%
jan 1, 2002
1.986
+0.38
23.69%
jan 1, 2003
2.081
+0.095
4.77%
jan 1, 2004
2.001
-0.08
-3.84%
jan 1, 2005
3.261
+1.26
62.99%
jan 1, 2006
2.619
-0.642
-19.68%
jan 1, 2007
3.48
+0.861
32.87%
jan 1, 2008
3.533
+0.053
1.52%
jan 1, 2009
2.931
-0.602
-17.05%
jan 1, 2010
2.503
-0.427
-14.58%
jan 1, 2011
2.197
-0.307
-12.25%
jan 1, 2012
2.513
+0.316
14.38%
jan 1, 2013
2.8
+0.287
11.44%
jan 1, 2014
1.793
-1.007
-35.95%
jan 1, 2015
1.705
-0.089
-4.95%
Ranking of countries by current statistics by years


Comments: