29
/
en
AIzaSyAYiBZKx7MnpbEhh9jyipgxe19OcubqV5w
April 1, 2024
40895
Late-demographic dividend
LTE
false
2
1
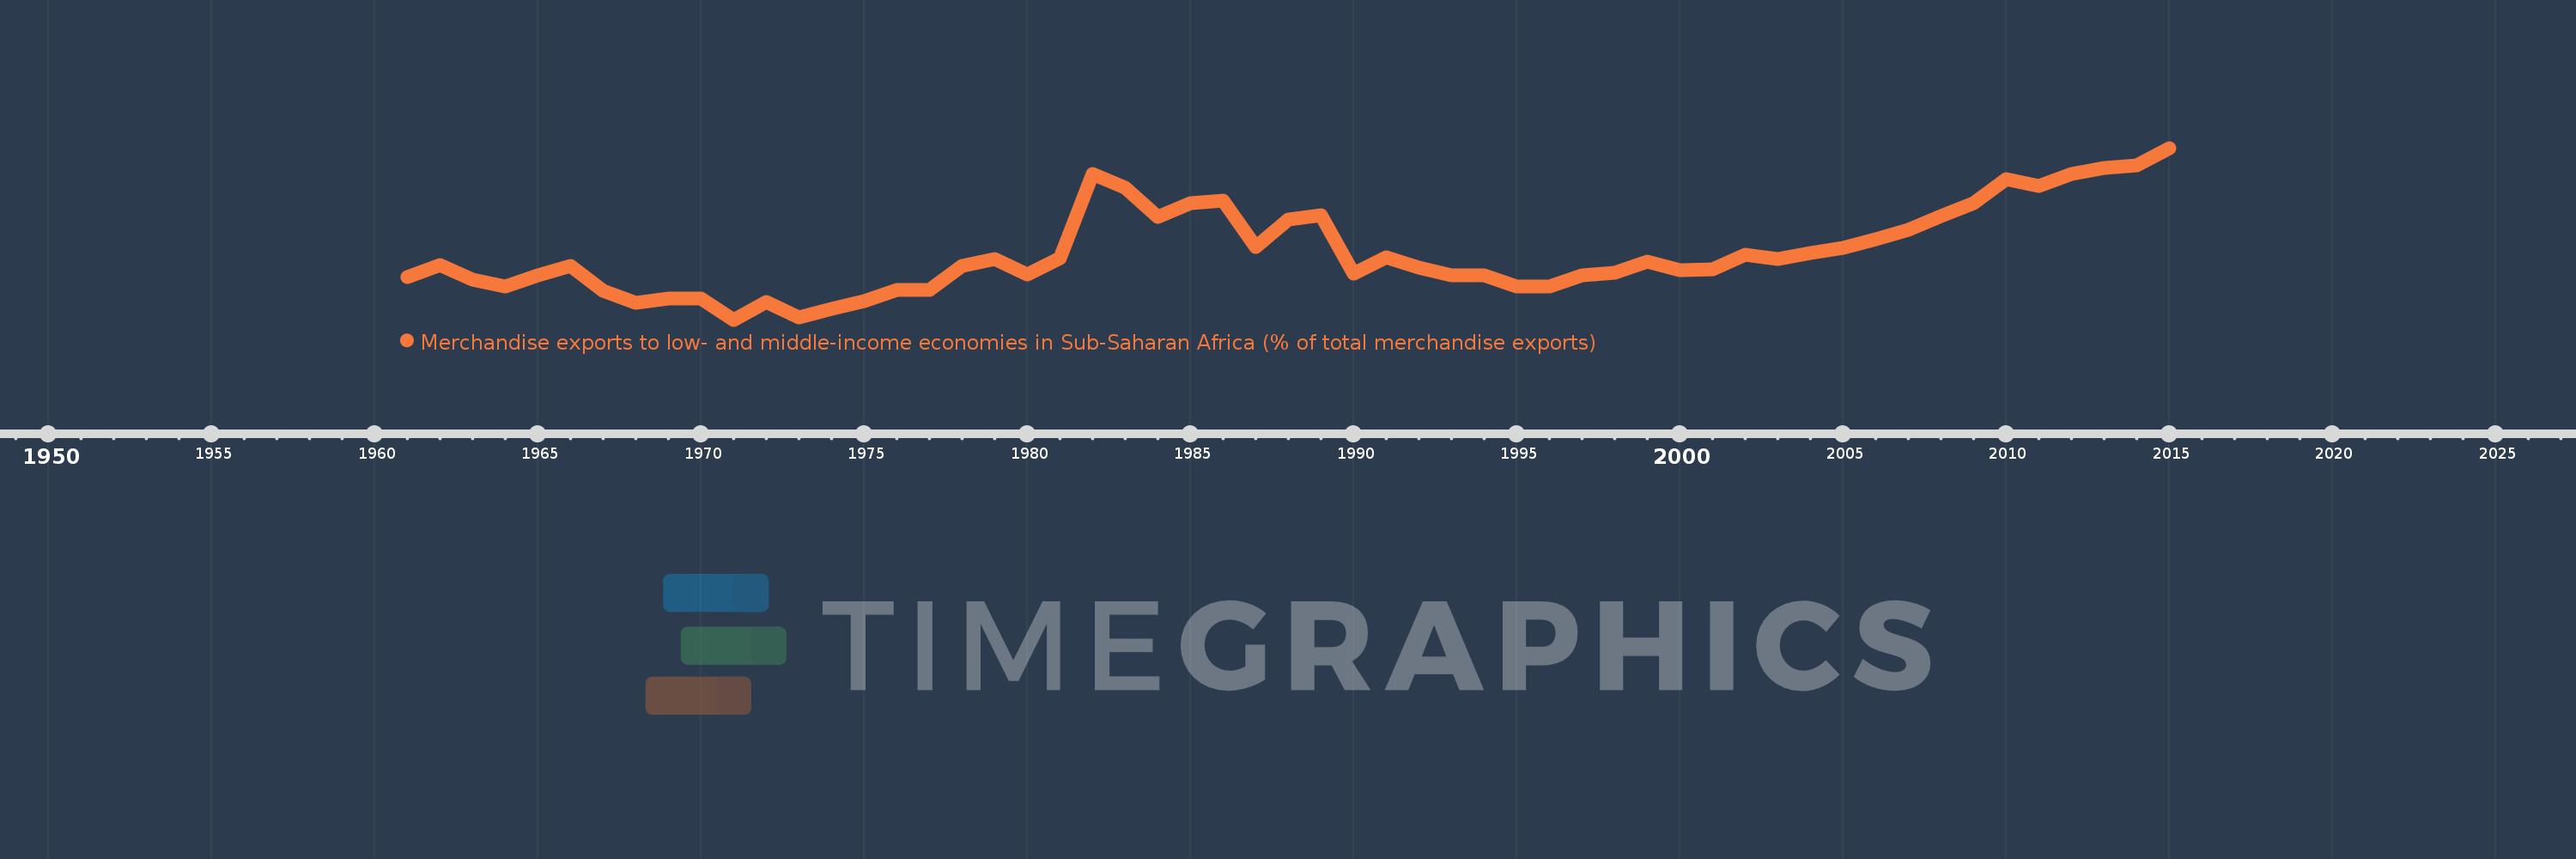
Merchandise exports to low- and middle-income economies in Sub-Saharan Africa (% of total merchandise exports)
2015,2014,2013,2012,2011,2010,2009,2008,2007,2006,2005,2004,2003,2002,2001,2000,1999,1998,1997,1996,1995,1994,1993,1992,1991,1990,1989,1988,1987,1986,1985,1984,1983,1982,1981,1980,1979,1978,1977,1976,1975,1974,1973,1972,1971,1970,1969,1968,1967,1966,1965,1964,1963,1962,1961
This statistics in other country:
AfghanistanAlbaniaAlgeriaAngolaArab WorldArgentinaArmeniaAustraliaAustriaAzerbaijanBahamas, TheBahrainBangladeshBarbadosBelarusBelgiumBelizeBeninBermudaBoliviaBrazilBulgariaBurkina FasoBurundiCabo VerdeCambodiaCameroonCanadaCaribbean small statesCentral African RepublicCentral Europe and the BalticsChadChileChinaColombiaCongo, Dem. Rep.Congo, Rep.Costa RicaCote d'IvoireCroatiaCubaCyprusCzech RepublicDenmarkDjiboutiDominicaDominican RepublicEarly-demographic dividendEast Asia & PacificEast Asia & Pacific (excluding high income)East Asia & Pacific (IDA & IBRD countries)EcuadorEgypt, Arab Rep.EstoniaEthiopiaEuro areaEurope & Central AsiaEurope & Central Asia (excluding high income)Europe & Central Asia (IDA & IBRD countries)European UnionFijiFinlandFragile and conflict affected situationsFranceGabonGambia, TheGeorgiaGermanyGhanaGibraltarGreeceGreenlandGuatemalaGuineaGuinea-BissauGuyanaHaitiHeavily indebted poor countries (HIPC)High incomeHondurasHong Kong SAR, ChinaHungaryIBRD onlyIcelandIDA & IBRD totalIDA blendIDA onlyIDA totalIndiaIndonesiaIran, Islamic Rep.IraqIrelandIsraelItalyJamaicaJapanJordanKazakhstanKenyaKorea, Dem. People’s Rep.Korea, Rep.KuwaitLao PDRLate-demographic dividendLatin America & Caribbean Latin America & Caribbean (excluding high income)Latin America & the Caribbean (IDA & IBRD countries)LatviaLeast developed countries: UN classificationLebanonLiberiaLibyaLithuaniaLow & middle incomeLow incomeLower middle incomeLuxembourgMacao SAR, ChinaMacedonia, FYRMadagascarMalawiMalaysiaMaliMaltaMauritaniaMauritiusMexicoMiddle East & North AfricaMiddle East & North Africa (excluding high income)Middle East & North Africa (IDA & IBRD countries)Middle incomeMoldovaMontenegroMoroccoMozambiqueMyanmarNetherlandsNew ZealandNicaraguaNigerNigeriaNorth AmericaNorwayOECD membersOmanOther small statesPacific island small statesPakistanPanamaPapua New GuineaParaguayPeruPhilippinesPolandPortugalPost-demographic dividendPre-demographic dividendQatarRomaniaRussian FederationRwandaSaudi ArabiaSenegalSerbiaSeychellesSierra LeoneSingaporeSlovak RepublicSloveniaSmall statesSomaliaSouth AfricaSouth AsiaSouth Asia (IDA & IBRD)SpainSri LankaSt. LuciaSt. Vincent and the GrenadinesSub-Saharan Africa Sub-Saharan Africa (excluding high income)Sub-Saharan Africa (IDA & IBRD countries)SudanSurinameSwedenSwitzerlandSyrian Arab RepublicTanzaniaThailandTogoTrinidad and TobagoTunisiaTurkeyUgandaUkraineUnited Arab EmiratesUnited KingdomUnited StatesUpper middle incomeUruguayVenezuela, RBVietnamWorldYemen, Rep.ZambiaZimbabwe Timeline:
This timeline shows a graph from 1961 to 2015 of Late-demographic dividend. No data until 1960. Number of actual observations by date: 55.
Source name:
World Development Indicators
Source organization:
World Bank staff estimates based data from International Monetary Fund's Direction of Trade database.
Categories, topics:
Private Sector, Trade
Last updated:
apr 23, 2017
Indicators value changes by year
At the date of observation
Value
Absolute change
Change from previous value
jan 1, 1961
0.987
+0.987
0.0%
jan 1, 1962
1.112
+0.124
12.6%
jan 1, 1963
0.962
-0.149
-13.42%
jan 1, 1964
0.891
-0.072
-7.47%
jan 1, 1965
1.0
+0.109
12.26%
jan 1, 1966
1.098
+0.098
9.83%
jan 1, 1967
0.845
-0.253
-23.02%
jan 1, 1968
0.723
-0.122
-14.49%
jan 1, 1969
0.771
+0.048
6.67%
jan 1, 1970
0.764
-0.007
-0.88%
jan 1, 1971
0.552
-0.212
-27.71%
jan 1, 1972
0.729
+0.176
31.92%
jan 1, 1973
0.579
-0.149
-20.5%
jan 1, 1974
0.664
+0.085
14.6%
jan 1, 1975
0.742
+0.078
11.75%
jan 1, 1976
0.858
+0.116
15.65%
jan 1, 1977
0.857
-0.001
-0.11%
jan 1, 1978
1.099
+0.242
28.2%
jan 1, 1979
1.166
+0.067
6.11%
jan 1, 1980
1.008
-0.158
-13.56%
jan 1, 1981
1.175
+0.167
16.57%
jan 1, 1982
2.035
+0.86
73.21%
jan 1, 1983
1.895
-0.14
-6.89%
jan 1, 1984
1.6
-0.295
-15.59%
jan 1, 1985
1.738
+0.139
8.66%
jan 1, 1986
1.76
+0.022
1.26%
jan 1, 1987
1.291
-0.469
-26.64%
jan 1, 1988
1.569
+0.278
21.53%
jan 1, 1989
1.616
+0.047
2.97%
jan 1, 1990
1.023
-0.592
-36.67%
jan 1, 1991
1.185
+0.162
15.83%
jan 1, 1992
1.083
-0.102
-8.61%
jan 1, 1993
0.999
-0.085
-7.82%
jan 1, 1994
1.006
+0.007
0.71%
jan 1, 1995
0.888
-0.117
-11.65%
jan 1, 1996
0.894
+0.006
0.63%
jan 1, 1997
1.002
+0.108
12.05%
jan 1, 1998
1.029
+0.027
2.69%
jan 1, 1999
1.143
+0.115
11.15%
jan 1, 2000
1.057
-0.087
-7.57%
jan 1, 2001
1.066
+0.009
0.83%
jan 1, 2002
1.21
+0.144
13.55%
jan 1, 2003
1.173
-0.037
-3.1%
jan 1, 2004
1.232
+0.06
5.1%
jan 1, 2005
1.282
+0.05
4.03%
jan 1, 2006
1.374
+0.092
7.14%
jan 1, 2007
1.468
+0.095
6.9%
jan 1, 2008
1.602
+0.133
9.08%
jan 1, 2009
1.736
+0.134
8.36%
jan 1, 2010
1.982
+0.246
14.18%
jan 1, 2011
1.911
-0.071
-3.58%
jan 1, 2012
2.032
+0.122
6.36%
jan 1, 2013
2.095
+0.063
3.08%
jan 1, 2014
2.121
+0.026
1.26%
jan 1, 2015
2.298
+0.176
8.31%
Ranking of countries by current statistics by years


Comments: