29
/
en
AIzaSyAYiBZKx7MnpbEhh9jyipgxe19OcubqV5w
April 1, 2024
119160
Denmark
DNK
true
2
1
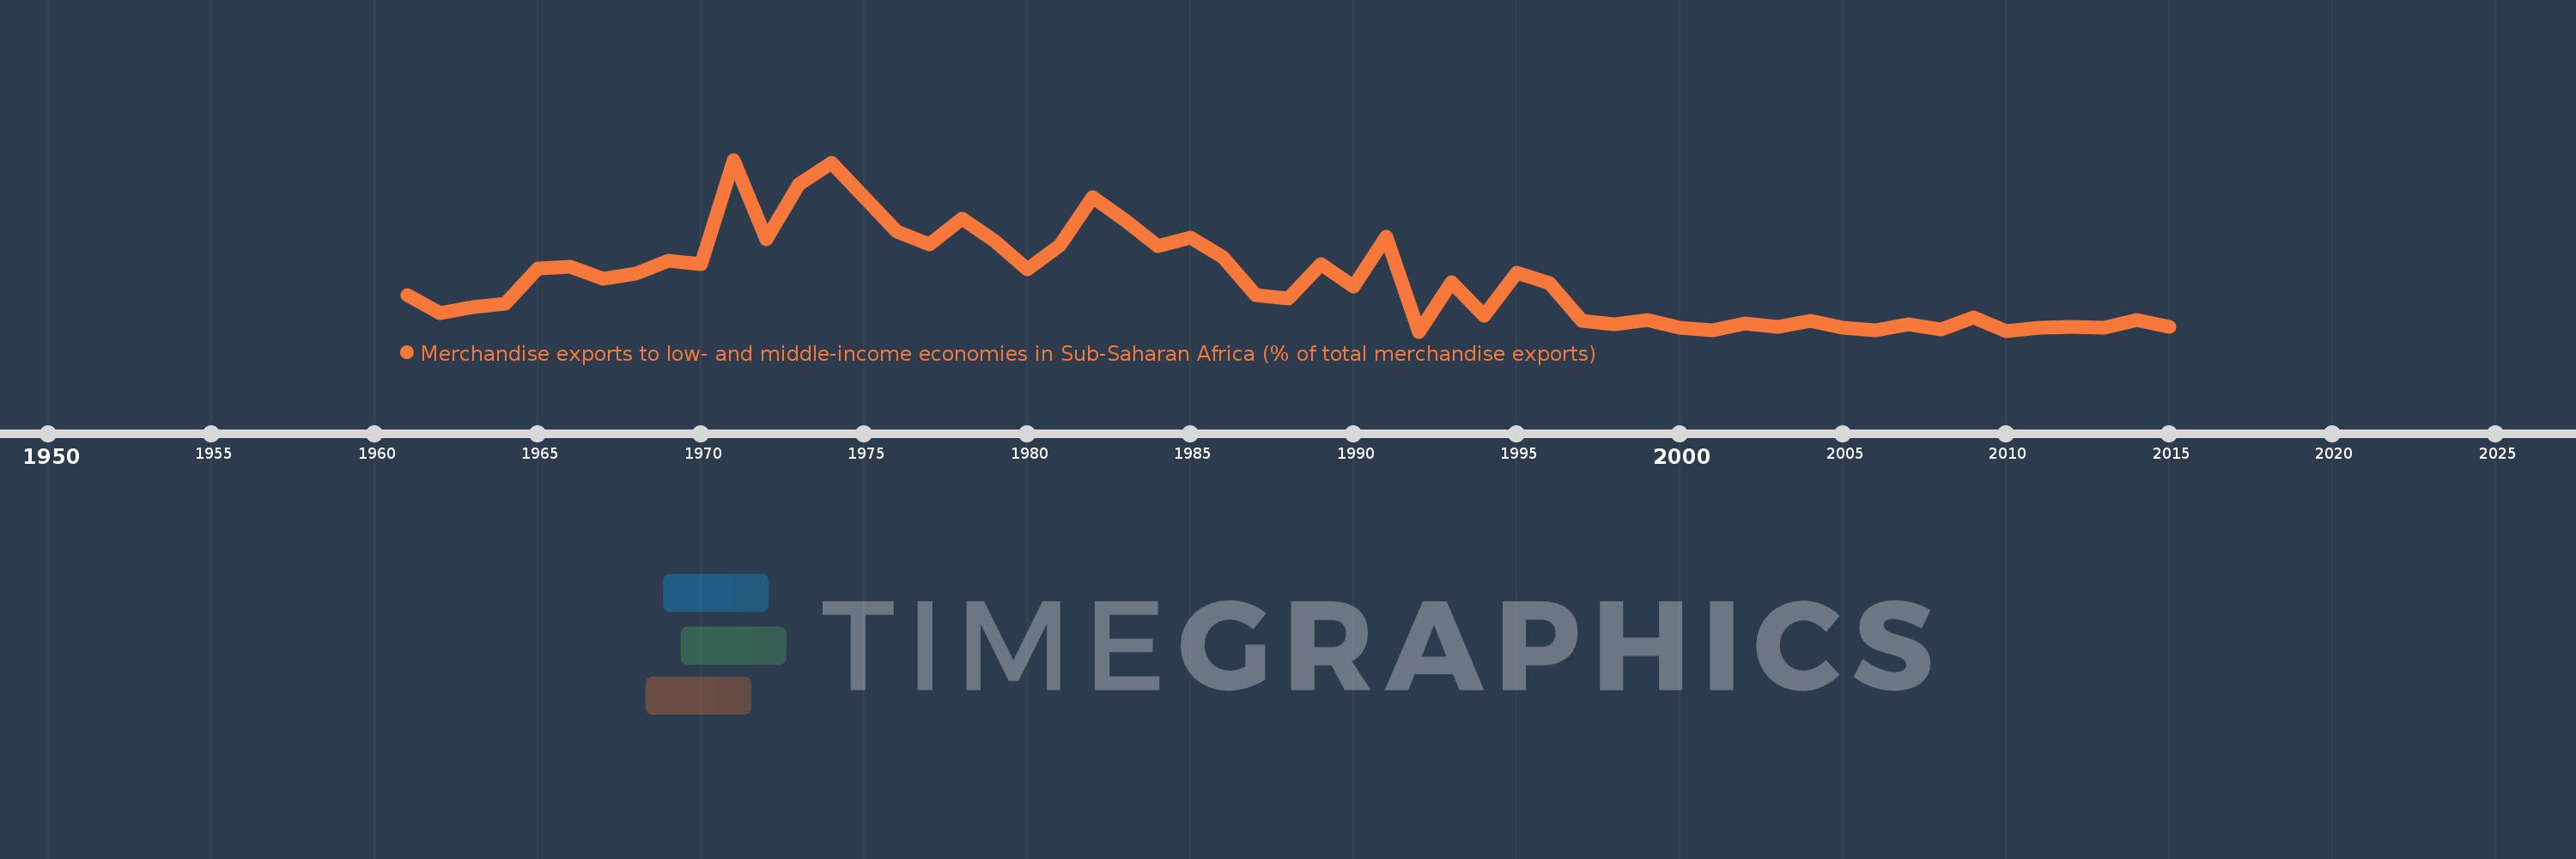
Merchandise exports to low- and middle-income economies in Sub-Saharan Africa (% of total merchandise exports)
2015,2014,2013,2012,2011,2010,2009,2008,2007,2006,2005,2004,2003,2002,2001,2000,1999,1998,1997,1996,1995,1994,1993,1992,1991,1990,1989,1988,1987,1986,1985,1984,1983,1982,1981,1980,1979,1978,1977,1976,1975,1974,1973,1972,1971,1970,1969,1968,1967,1966,1965,1964,1963,1962,1961
This statistics in other country:
AfghanistanAlbaniaAlgeriaAngolaArab WorldArgentinaArmeniaAustraliaAustriaAzerbaijanBahamas, TheBahrainBangladeshBarbadosBelarusBelgiumBelizeBeninBermudaBoliviaBrazilBulgariaBurkina FasoBurundiCabo VerdeCambodiaCameroonCanadaCaribbean small statesCentral African RepublicCentral Europe and the BalticsChadChileChinaColombiaCongo, Dem. Rep.Congo, Rep.Costa RicaCote d'IvoireCroatiaCubaCyprusCzech RepublicDenmarkDjiboutiDominicaDominican RepublicEarly-demographic dividendEast Asia & PacificEast Asia & Pacific (excluding high income)East Asia & Pacific (IDA & IBRD countries)EcuadorEgypt, Arab Rep.EstoniaEthiopiaEuro areaEurope & Central AsiaEurope & Central Asia (excluding high income)Europe & Central Asia (IDA & IBRD countries)European UnionFijiFinlandFragile and conflict affected situationsFranceGabonGambia, TheGeorgiaGermanyGhanaGibraltarGreeceGreenlandGuatemalaGuineaGuinea-BissauGuyanaHaitiHeavily indebted poor countries (HIPC)High incomeHondurasHong Kong SAR, ChinaHungaryIBRD onlyIcelandIDA & IBRD totalIDA blendIDA onlyIDA totalIndiaIndonesiaIran, Islamic Rep.IraqIrelandIsraelItalyJamaicaJapanJordanKazakhstanKenyaKorea, Dem. People’s Rep.Korea, Rep.KuwaitLao PDRLate-demographic dividendLatin America & Caribbean Latin America & Caribbean (excluding high income)Latin America & the Caribbean (IDA & IBRD countries)LatviaLeast developed countries: UN classificationLebanonLiberiaLibyaLithuaniaLow & middle incomeLow incomeLower middle incomeLuxembourgMacao SAR, ChinaMacedonia, FYRMadagascarMalawiMalaysiaMaliMaltaMauritaniaMauritiusMexicoMiddle East & North AfricaMiddle East & North Africa (excluding high income)Middle East & North Africa (IDA & IBRD countries)Middle incomeMoldovaMontenegroMoroccoMozambiqueMyanmarNetherlandsNew ZealandNicaraguaNigerNigeriaNorth AmericaNorwayOECD membersOmanOther small statesPacific island small statesPakistanPanamaPapua New GuineaParaguayPeruPhilippinesPolandPortugalPost-demographic dividendPre-demographic dividendQatarRomaniaRussian FederationRwandaSaudi ArabiaSenegalSerbiaSeychellesSierra LeoneSingaporeSlovak RepublicSloveniaSmall statesSomaliaSouth AfricaSouth AsiaSouth Asia (IDA & IBRD)SpainSri LankaSt. LuciaSt. Vincent and the GrenadinesSub-Saharan Africa Sub-Saharan Africa (excluding high income)Sub-Saharan Africa (IDA & IBRD countries)SudanSurinameSwedenSwitzerlandSyrian Arab RepublicTanzaniaThailandTogoTrinidad and TobagoTunisiaTurkeyUgandaUkraineUnited Arab EmiratesUnited KingdomUnited StatesUpper middle incomeUruguayVenezuela, RBVietnamWorldYemen, Rep.ZambiaZimbabwe Timeline:
This timeline shows a graph from 1961 to 2015 of Denmark. No data until 1960. Number of actual observations by date: 55.
Source name:
World Development Indicators
Source organization:
World Bank staff estimates based data from International Monetary Fund's Direction of Trade database.
Categories, topics:
Private Sector, Trade
Last updated:
apr 23, 2017
Indicators value changes by year
At the date of observation
Value
Absolute change
Change from previous value
jan 1, 1961
1.127
+1.127
0.0%
jan 1, 1962
0.854
-0.273
-24.23%
jan 1, 1963
0.948
+0.095
11.11%
jan 1, 1964
0.99
+0.041
4.33%
jan 1, 1965
1.548
+0.558
56.42%
jan 1, 1966
1.577
+0.029
1.87%
jan 1, 1967
1.379
-0.197
-12.51%
jan 1, 1968
1.458
+0.079
5.73%
jan 1, 1969
1.665
+0.206
14.13%
jan 1, 1970
1.607
-0.057
-3.45%
jan 1, 1971
3.236
+1.629
101.35%
jan 1, 1972
2.001
-1.235
-38.17%
jan 1, 1973
2.859
+0.858
42.88%
jan 1, 1974
3.188
+0.329
11.5%
jan 1, 1975
2.654
-0.534
-16.75%
jan 1, 1976
2.121
-0.532
-20.06%
jan 1, 1977
1.923
-0.198
-9.34%
jan 1, 1978
2.321
+0.398
20.69%
jan 1, 1979
1.967
-0.354
-15.24%
jan 1, 1980
1.536
-0.431
-21.92%
jan 1, 1981
1.907
+0.371
24.16%
jan 1, 1982
2.65
+0.743
38.94%
jan 1, 1983
2.293
-0.356
-13.45%
jan 1, 1984
1.894
-0.399
-17.39%
jan 1, 1985
2.022
+0.128
6.73%
jan 1, 1986
1.722
-0.3
-14.84%
jan 1, 1987
1.124
-0.598
-34.72%
jan 1, 1988
1.076
-0.048
-4.25%
jan 1, 1989
1.612
+0.536
49.76%
jan 1, 1990
1.267
-0.345
-21.4%
jan 1, 1991
2.034
+0.767
60.58%
jan 1, 1992
0.561
-1.474
-72.44%
jan 1, 1993
1.325
+0.765
136.45%
jan 1, 1994
0.806
-0.519
-39.16%
jan 1, 1995
1.472
+0.665
82.51%
jan 1, 1996
1.312
-0.159
-10.83%
jan 1, 1997
0.729
-0.583
-44.44%
jan 1, 1998
0.67
-0.059
-8.13%
jan 1, 1999
0.736
+0.066
9.8%
jan 1, 2000
0.626
-0.11
-14.9%
jan 1, 2001
0.583
-0.043
-6.92%
jan 1, 2002
0.684
+0.102
17.45%
jan 1, 2003
0.64
-0.044
-6.48%
jan 1, 2004
0.732
+0.092
14.34%
jan 1, 2005
0.623
-0.109
-14.92%
jan 1, 2006
0.576
-0.046
-7.43%
jan 1, 2007
0.67
+0.094
16.29%
jan 1, 2008
0.589
-0.081
-12.07%
jan 1, 2009
0.783
+0.194
32.94%
jan 1, 2010
0.574
-0.209
-26.67%
jan 1, 2011
0.62
+0.045
7.88%
jan 1, 2012
0.633
+0.013
2.17%
jan 1, 2013
0.622
-0.011
-1.81%
jan 1, 2014
0.741
+0.119
19.16%
jan 1, 2015
0.639
-0.102
-13.71%
Ranking of countries by current statistics by years


Comments: