29
/
en
AIzaSyAYiBZKx7MnpbEhh9jyipgxe19OcubqV5w
April 1, 2024
24289
Arab World
ARB
false
2
1
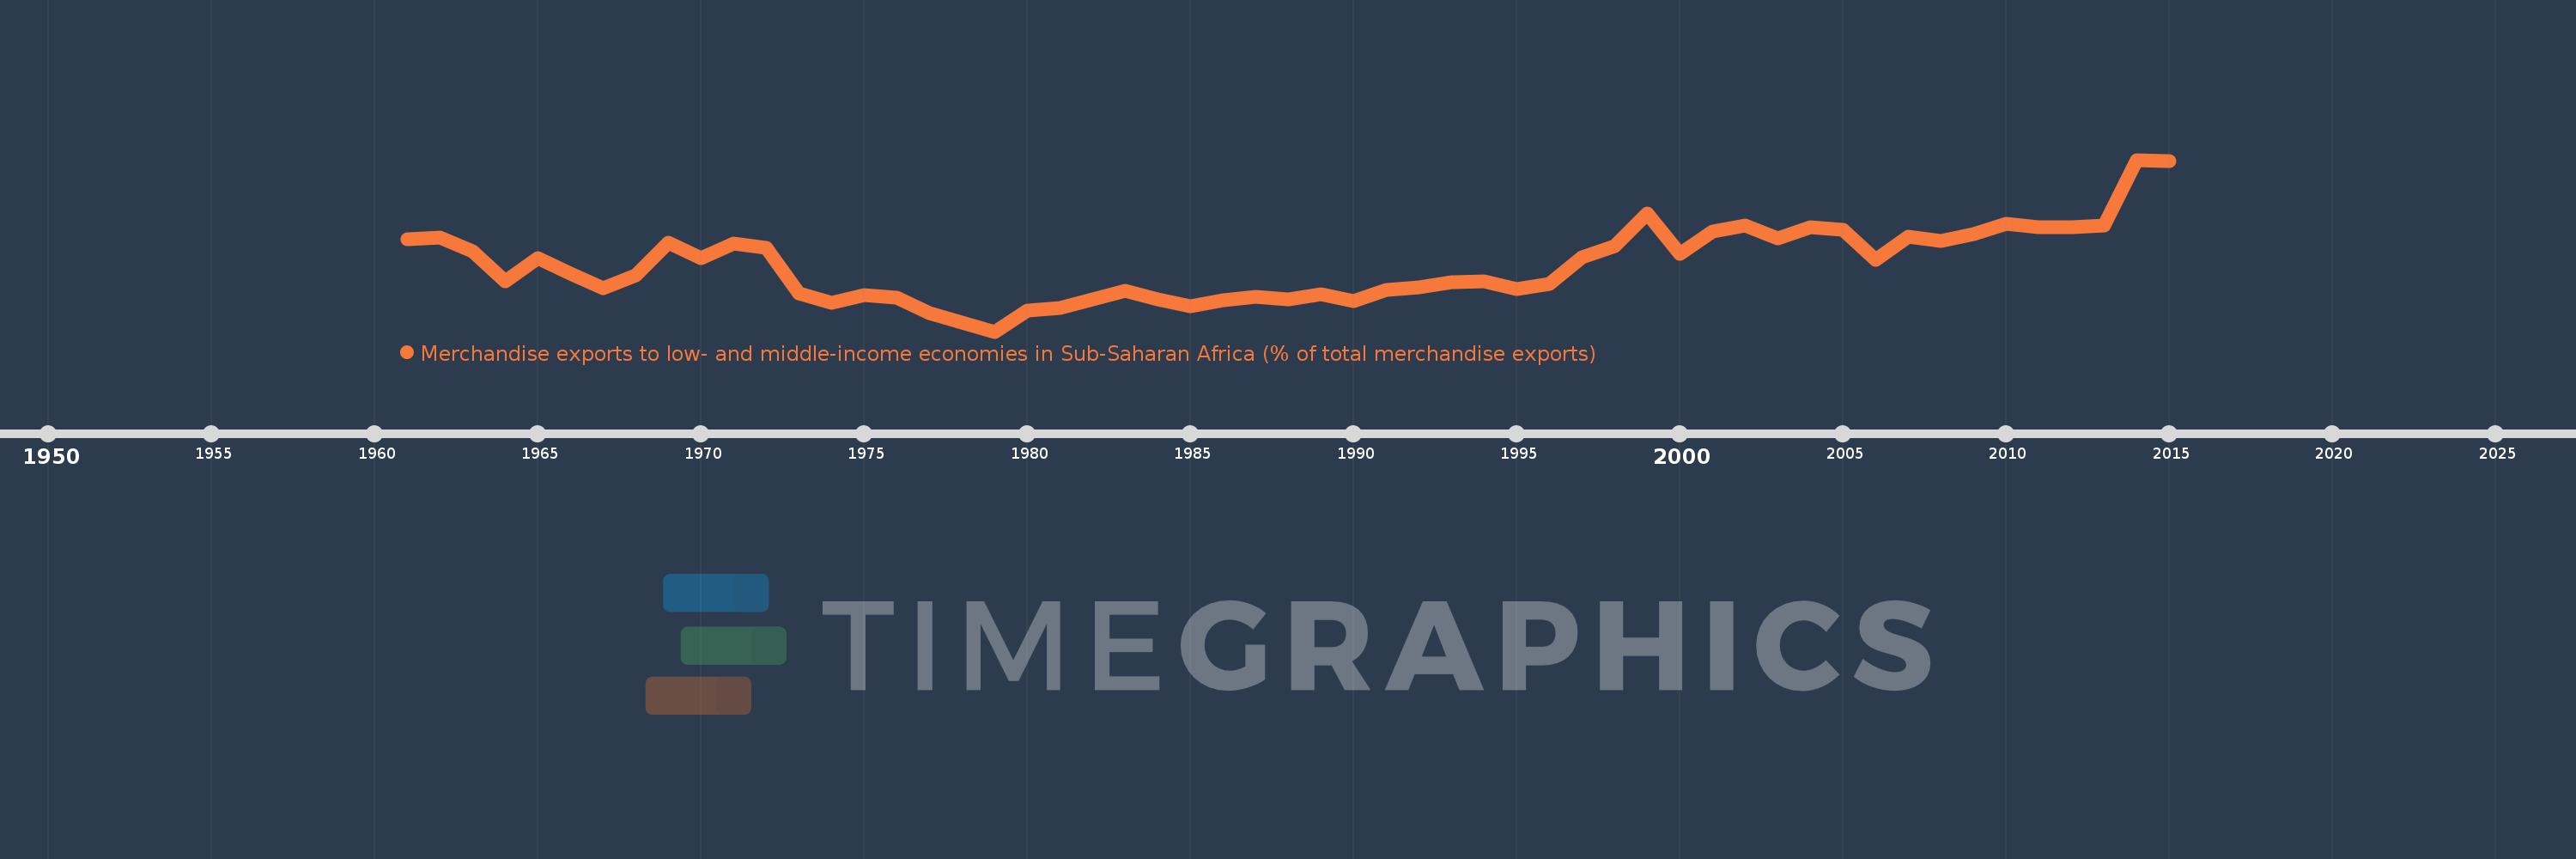
Merchandise exports to low- and middle-income economies in Sub-Saharan Africa (% of total merchandise exports)
2015,2014,2013,2012,2011,2010,2009,2008,2007,2006,2005,2004,2003,2002,2001,2000,1999,1998,1997,1996,1995,1994,1993,1992,1991,1990,1989,1988,1987,1986,1985,1984,1983,1982,1981,1980,1979,1978,1977,1976,1975,1974,1973,1972,1971,1970,1969,1968,1967,1966,1965,1964,1963,1962,1961
This statistics in other country:
AfghanistanAlbaniaAlgeriaAngolaArab WorldArgentinaArmeniaAustraliaAustriaAzerbaijanBahamas, TheBahrainBangladeshBarbadosBelarusBelgiumBelizeBeninBermudaBoliviaBrazilBulgariaBurkina FasoBurundiCabo VerdeCambodiaCameroonCanadaCaribbean small statesCentral African RepublicCentral Europe and the BalticsChadChileChinaColombiaCongo, Dem. Rep.Congo, Rep.Costa RicaCote d'IvoireCroatiaCubaCyprusCzech RepublicDenmarkDjiboutiDominicaDominican RepublicEarly-demographic dividendEast Asia & PacificEast Asia & Pacific (excluding high income)East Asia & Pacific (IDA & IBRD countries)EcuadorEgypt, Arab Rep.EstoniaEthiopiaEuro areaEurope & Central AsiaEurope & Central Asia (excluding high income)Europe & Central Asia (IDA & IBRD countries)European UnionFijiFinlandFragile and conflict affected situationsFranceGabonGambia, TheGeorgiaGermanyGhanaGibraltarGreeceGreenlandGuatemalaGuineaGuinea-BissauGuyanaHaitiHeavily indebted poor countries (HIPC)High incomeHondurasHong Kong SAR, ChinaHungaryIBRD onlyIcelandIDA & IBRD totalIDA blendIDA onlyIDA totalIndiaIndonesiaIran, Islamic Rep.IraqIrelandIsraelItalyJamaicaJapanJordanKazakhstanKenyaKorea, Dem. People’s Rep.Korea, Rep.KuwaitLao PDRLate-demographic dividendLatin America & Caribbean Latin America & Caribbean (excluding high income)Latin America & the Caribbean (IDA & IBRD countries)LatviaLeast developed countries: UN classificationLebanonLiberiaLibyaLithuaniaLow & middle incomeLow incomeLower middle incomeLuxembourgMacao SAR, ChinaMacedonia, FYRMadagascarMalawiMalaysiaMaliMaltaMauritaniaMauritiusMexicoMiddle East & North AfricaMiddle East & North Africa (excluding high income)Middle East & North Africa (IDA & IBRD countries)Middle incomeMoldovaMontenegroMoroccoMozambiqueMyanmarNetherlandsNew ZealandNicaraguaNigerNigeriaNorth AmericaNorwayOECD membersOmanOther small statesPacific island small statesPakistanPanamaPapua New GuineaParaguayPeruPhilippinesPolandPortugalPost-demographic dividendPre-demographic dividendQatarRomaniaRussian FederationRwandaSaudi ArabiaSenegalSerbiaSeychellesSierra LeoneSingaporeSlovak RepublicSloveniaSmall statesSomaliaSouth AfricaSouth AsiaSouth Asia (IDA & IBRD)SpainSri LankaSt. LuciaSt. Vincent and the GrenadinesSub-Saharan Africa Sub-Saharan Africa (excluding high income)Sub-Saharan Africa (IDA & IBRD countries)SudanSurinameSwedenSwitzerlandSyrian Arab RepublicTanzaniaThailandTogoTrinidad and TobagoTunisiaTurkeyUgandaUkraineUnited Arab EmiratesUnited KingdomUnited StatesUpper middle incomeUruguayVenezuela, RBVietnamWorldYemen, Rep.ZambiaZimbabwe Timeline:
This timeline shows a graph from 1961 to 2015 of Arab World. No data until 1960. Number of actual observations by date: 55.
Source name:
World Development Indicators
Source organization:
World Bank staff estimates based data from International Monetary Fund's Direction of Trade database.
Categories, topics:
Private Sector, Trade
Last updated:
apr 23, 2017
Indicators value changes by year
At the date of observation
Value
Absolute change
Change from previous value
jan 1, 1961
2.037
+2.037
0.0%
jan 1, 1962
2.067
+0.03
1.47%
jan 1, 1963
1.824
-0.244
-11.79%
jan 1, 1964
1.299
-0.524
-28.74%
jan 1, 1965
1.709
+0.41
31.55%
jan 1, 1966
1.43
-0.28
-16.37%
jan 1, 1967
1.174
-0.256
-17.88%
jan 1, 1968
1.408
+0.234
19.95%
jan 1, 1969
1.977
+0.569
40.43%
jan 1, 1970
1.707
-0.271
-13.7%
jan 1, 1971
1.966
+0.26
15.22%
jan 1, 1972
1.89
-0.076
-3.88%
jan 1, 1973
1.093
-0.797
-42.18%
jan 1, 1974
0.916
-0.177
-16.17%
jan 1, 1975
1.057
+0.141
15.37%
jan 1, 1976
1.017
-0.04
-3.76%
jan 1, 1977
0.742
-0.276
-27.09%
jan 1, 1978
0.579
-0.163
-21.98%
jan 1, 1979
0.419
-0.16
-27.64%
jan 1, 1980
0.789
+0.371
88.53%
jan 1, 1981
0.827
+0.038
4.76%
jan 1, 1982
0.98
+0.153
18.46%
jan 1, 1983
1.138
+0.158
16.17%
jan 1, 1984
0.976
-0.162
-14.24%
jan 1, 1985
0.857
-0.119
-12.21%
jan 1, 1986
0.963
+0.106
12.34%
jan 1, 1987
1.029
+0.066
6.85%
jan 1, 1988
0.98
-0.049
-4.72%
jan 1, 1989
1.066
+0.086
8.74%
jan 1, 1990
0.952
-0.114
-10.66%
jan 1, 1991
1.155
+0.203
21.36%
jan 1, 1992
1.196
+0.041
3.54%
jan 1, 1993
1.286
+0.089
7.48%
jan 1, 1994
1.3
+0.014
1.08%
jan 1, 1995
1.17
-0.13
-10.0%
jan 1, 1996
1.248
+0.078
6.66%
jan 1, 1997
1.713
+0.466
37.32%
jan 1, 1998
1.913
+0.2
11.69%
jan 1, 1999
2.491
+0.578
30.21%
jan 1, 2000
1.772
-0.719
-28.86%
jan 1, 2001
2.177
+0.404
22.82%
jan 1, 2002
2.27
+0.093
4.29%
jan 1, 2003
2.048
-0.222
-9.78%
jan 1, 2004
2.243
+0.195
9.52%
jan 1, 2005
2.206
-0.038
-1.67%
jan 1, 2006
1.68
-0.526
-23.83%
jan 1, 2007
2.075
+0.395
23.53%
jan 1, 2008
1.998
-0.077
-3.72%
jan 1, 2009
2.128
+0.13
6.48%
jan 1, 2010
2.301
+0.174
8.17%
jan 1, 2011
2.244
-0.058
-2.5%
jan 1, 2012
2.248
+0.004
0.16%
jan 1, 2013
2.281
+0.034
1.49%
jan 1, 2014
3.425
+1.143
50.13%
jan 1, 2015
3.409
-0.016
-0.47%
Ranking of countries by current statistics by years


Comments: