29
/
en
AIzaSyAYiBZKx7MnpbEhh9jyipgxe19OcubqV5w
April 1, 2024
36764
IBRD only
IBD
false
2
1
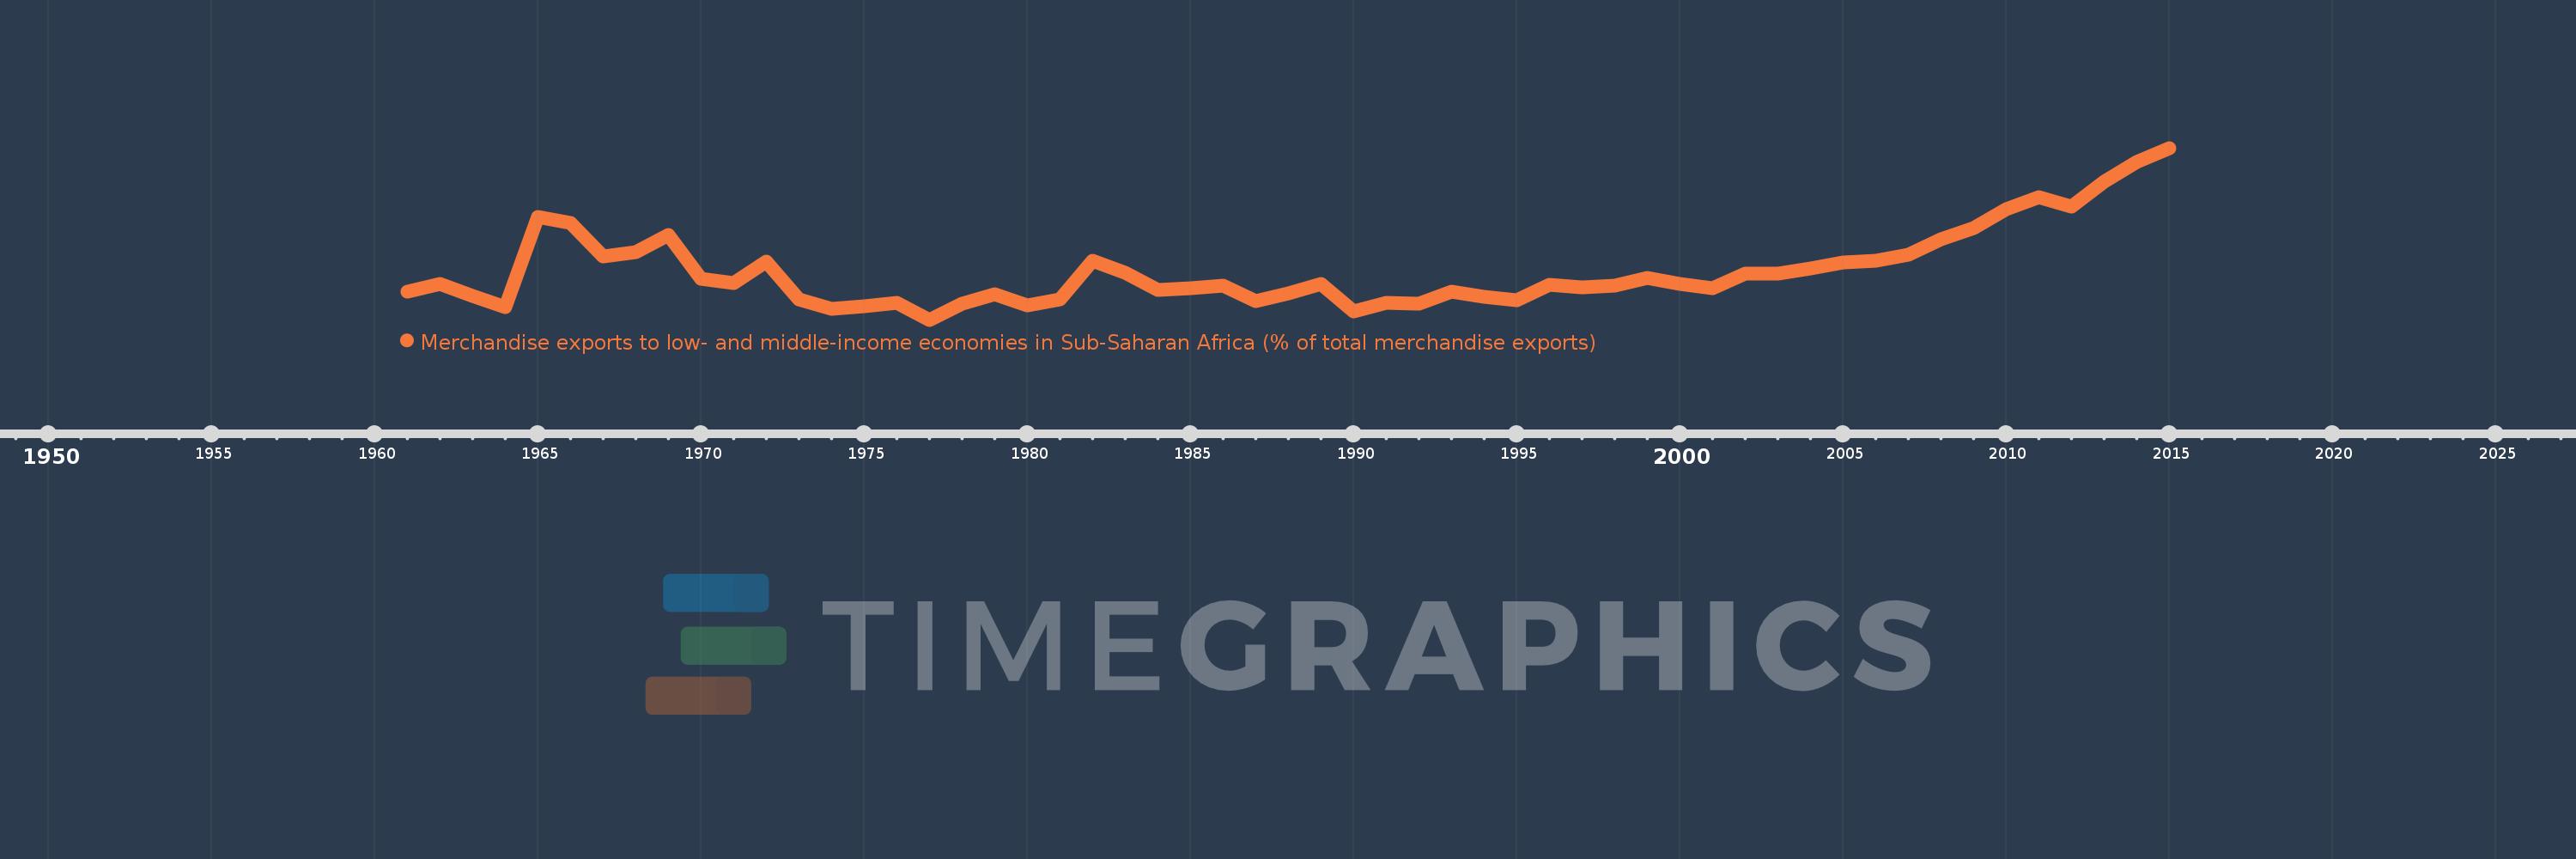
Merchandise exports to low- and middle-income economies in Sub-Saharan Africa (% of total merchandise exports)
2015,2014,2013,2012,2011,2010,2009,2008,2007,2006,2005,2004,2003,2002,2001,2000,1999,1998,1997,1996,1995,1994,1993,1992,1991,1990,1989,1988,1987,1986,1985,1984,1983,1982,1981,1980,1979,1978,1977,1976,1975,1974,1973,1972,1971,1970,1969,1968,1967,1966,1965,1964,1963,1962,1961
This statistics in other country:
AfghanistanAlbaniaAlgeriaAngolaArab WorldArgentinaArmeniaAustraliaAustriaAzerbaijanBahamas, TheBahrainBangladeshBarbadosBelarusBelgiumBelizeBeninBermudaBoliviaBrazilBulgariaBurkina FasoBurundiCabo VerdeCambodiaCameroonCanadaCaribbean small statesCentral African RepublicCentral Europe and the BalticsChadChileChinaColombiaCongo, Dem. Rep.Congo, Rep.Costa RicaCote d'IvoireCroatiaCubaCyprusCzech RepublicDenmarkDjiboutiDominicaDominican RepublicEarly-demographic dividendEast Asia & PacificEast Asia & Pacific (excluding high income)East Asia & Pacific (IDA & IBRD countries)EcuadorEgypt, Arab Rep.EstoniaEthiopiaEuro areaEurope & Central AsiaEurope & Central Asia (excluding high income)Europe & Central Asia (IDA & IBRD countries)European UnionFijiFinlandFragile and conflict affected situationsFranceGabonGambia, TheGeorgiaGermanyGhanaGibraltarGreeceGreenlandGuatemalaGuineaGuinea-BissauGuyanaHaitiHeavily indebted poor countries (HIPC)High incomeHondurasHong Kong SAR, ChinaHungaryIBRD onlyIcelandIDA & IBRD totalIDA blendIDA onlyIDA totalIndiaIndonesiaIran, Islamic Rep.IraqIrelandIsraelItalyJamaicaJapanJordanKazakhstanKenyaKorea, Dem. People’s Rep.Korea, Rep.KuwaitLao PDRLate-demographic dividendLatin America & Caribbean Latin America & Caribbean (excluding high income)Latin America & the Caribbean (IDA & IBRD countries)LatviaLeast developed countries: UN classificationLebanonLiberiaLibyaLithuaniaLow & middle incomeLow incomeLower middle incomeLuxembourgMacao SAR, ChinaMacedonia, FYRMadagascarMalawiMalaysiaMaliMaltaMauritaniaMauritiusMexicoMiddle East & North AfricaMiddle East & North Africa (excluding high income)Middle East & North Africa (IDA & IBRD countries)Middle incomeMoldovaMontenegroMoroccoMozambiqueMyanmarNetherlandsNew ZealandNicaraguaNigerNigeriaNorth AmericaNorwayOECD membersOmanOther small statesPacific island small statesPakistanPanamaPapua New GuineaParaguayPeruPhilippinesPolandPortugalPost-demographic dividendPre-demographic dividendQatarRomaniaRussian FederationRwandaSaudi ArabiaSenegalSerbiaSeychellesSierra LeoneSingaporeSlovak RepublicSloveniaSmall statesSomaliaSouth AfricaSouth AsiaSouth Asia (IDA & IBRD)SpainSri LankaSt. LuciaSt. Vincent and the GrenadinesSub-Saharan Africa Sub-Saharan Africa (excluding high income)Sub-Saharan Africa (IDA & IBRD countries)SudanSurinameSwedenSwitzerlandSyrian Arab RepublicTanzaniaThailandTogoTrinidad and TobagoTunisiaTurkeyUgandaUkraineUnited Arab EmiratesUnited KingdomUnited StatesUpper middle incomeUruguayVenezuela, RBVietnamWorldYemen, Rep.ZambiaZimbabwe Timeline:
This timeline shows a graph from 1961 to 2015 of IBRD only. No data until 1960. Number of actual observations by date: 55.
Source name:
World Development Indicators
Source organization:
World Bank staff estimates based data from International Monetary Fund's Direction of Trade database.
Categories, topics:
Private Sector, Trade
Last updated:
apr 23, 2017
Indicators value changes by year
At the date of observation
Value
Absolute change
Change from previous value
jan 1, 1961
1.228
+1.228
0.0%
jan 1, 1962
1.331
+0.104
8.44%
jan 1, 1963
1.174
-0.157
-11.77%
jan 1, 1964
1.032
-0.143
-12.15%
jan 1, 1965
2.206
+1.175
113.84%
jan 1, 1966
2.129
-0.077
-3.51%
jan 1, 1967
1.688
-0.441
-20.7%
jan 1, 1968
1.752
+0.064
3.77%
jan 1, 1969
1.969
+0.217
12.41%
jan 1, 1970
1.399
-0.57
-28.95%
jan 1, 1971
1.344
-0.056
-3.98%
jan 1, 1972
1.62
+0.276
20.55%
jan 1, 1973
1.131
-0.489
-30.17%
jan 1, 1974
1.012
-0.119
-10.5%
jan 1, 1975
1.041
+0.029
2.88%
jan 1, 1976
1.089
+0.047
4.55%
jan 1, 1977
0.865
-0.224
-20.53%
jan 1, 1978
1.07
+0.205
23.69%
jan 1, 1979
1.196
+0.125
11.72%
jan 1, 1980
1.052
-0.143
-11.98%
jan 1, 1981
1.129
+0.077
7.28%
jan 1, 1982
1.639
+0.51
45.21%
jan 1, 1983
1.479
-0.16
-9.78%
jan 1, 1984
1.255
-0.224
-15.13%
jan 1, 1985
1.281
+0.026
2.04%
jan 1, 1986
1.311
+0.029
2.3%
jan 1, 1987
1.112
-0.199
-15.18%
jan 1, 1988
1.208
+0.096
8.64%
jan 1, 1989
1.334
+0.126
10.42%
jan 1, 1990
0.972
-0.362
-27.11%
jan 1, 1991
1.091
+0.119
12.28%
jan 1, 1992
1.078
-0.014
-1.24%
jan 1, 1993
1.233
+0.155
14.41%
jan 1, 1994
1.165
-0.069
-5.56%
jan 1, 1995
1.124
-0.041
-3.5%
jan 1, 1996
1.326
+0.202
17.98%
jan 1, 1997
1.288
-0.038
-2.84%
jan 1, 1998
1.314
+0.026
2.01%
jan 1, 1999
1.413
+0.099
7.55%
jan 1, 2000
1.336
-0.077
-5.47%
jan 1, 2001
1.281
-0.055
-4.13%
jan 1, 2002
1.472
+0.191
14.93%
jan 1, 2003
1.472
+0.0
0.03%
jan 1, 2004
1.536
+0.064
4.34%
jan 1, 2005
1.617
+0.08
5.22%
jan 1, 2006
1.642
+0.025
1.58%
jan 1, 2007
1.718
+0.076
4.63%
jan 1, 2008
1.914
+0.196
11.43%
jan 1, 2009
2.065
+0.15
7.85%
jan 1, 2010
2.313
+0.249
12.04%
jan 1, 2011
2.466
+0.153
6.61%
jan 1, 2012
2.347
-0.119
-4.82%
jan 1, 2013
2.67
+0.323
13.74%
jan 1, 2014
2.931
+0.261
9.78%
jan 1, 2015
3.112
+0.181
6.16%
Ranking of countries by current statistics by years


Comments: