29
/
en
AIzaSyAYiBZKx7MnpbEhh9jyipgxe19OcubqV5w
April 1, 2024
245882
South Africa
ZAF
true
2
1
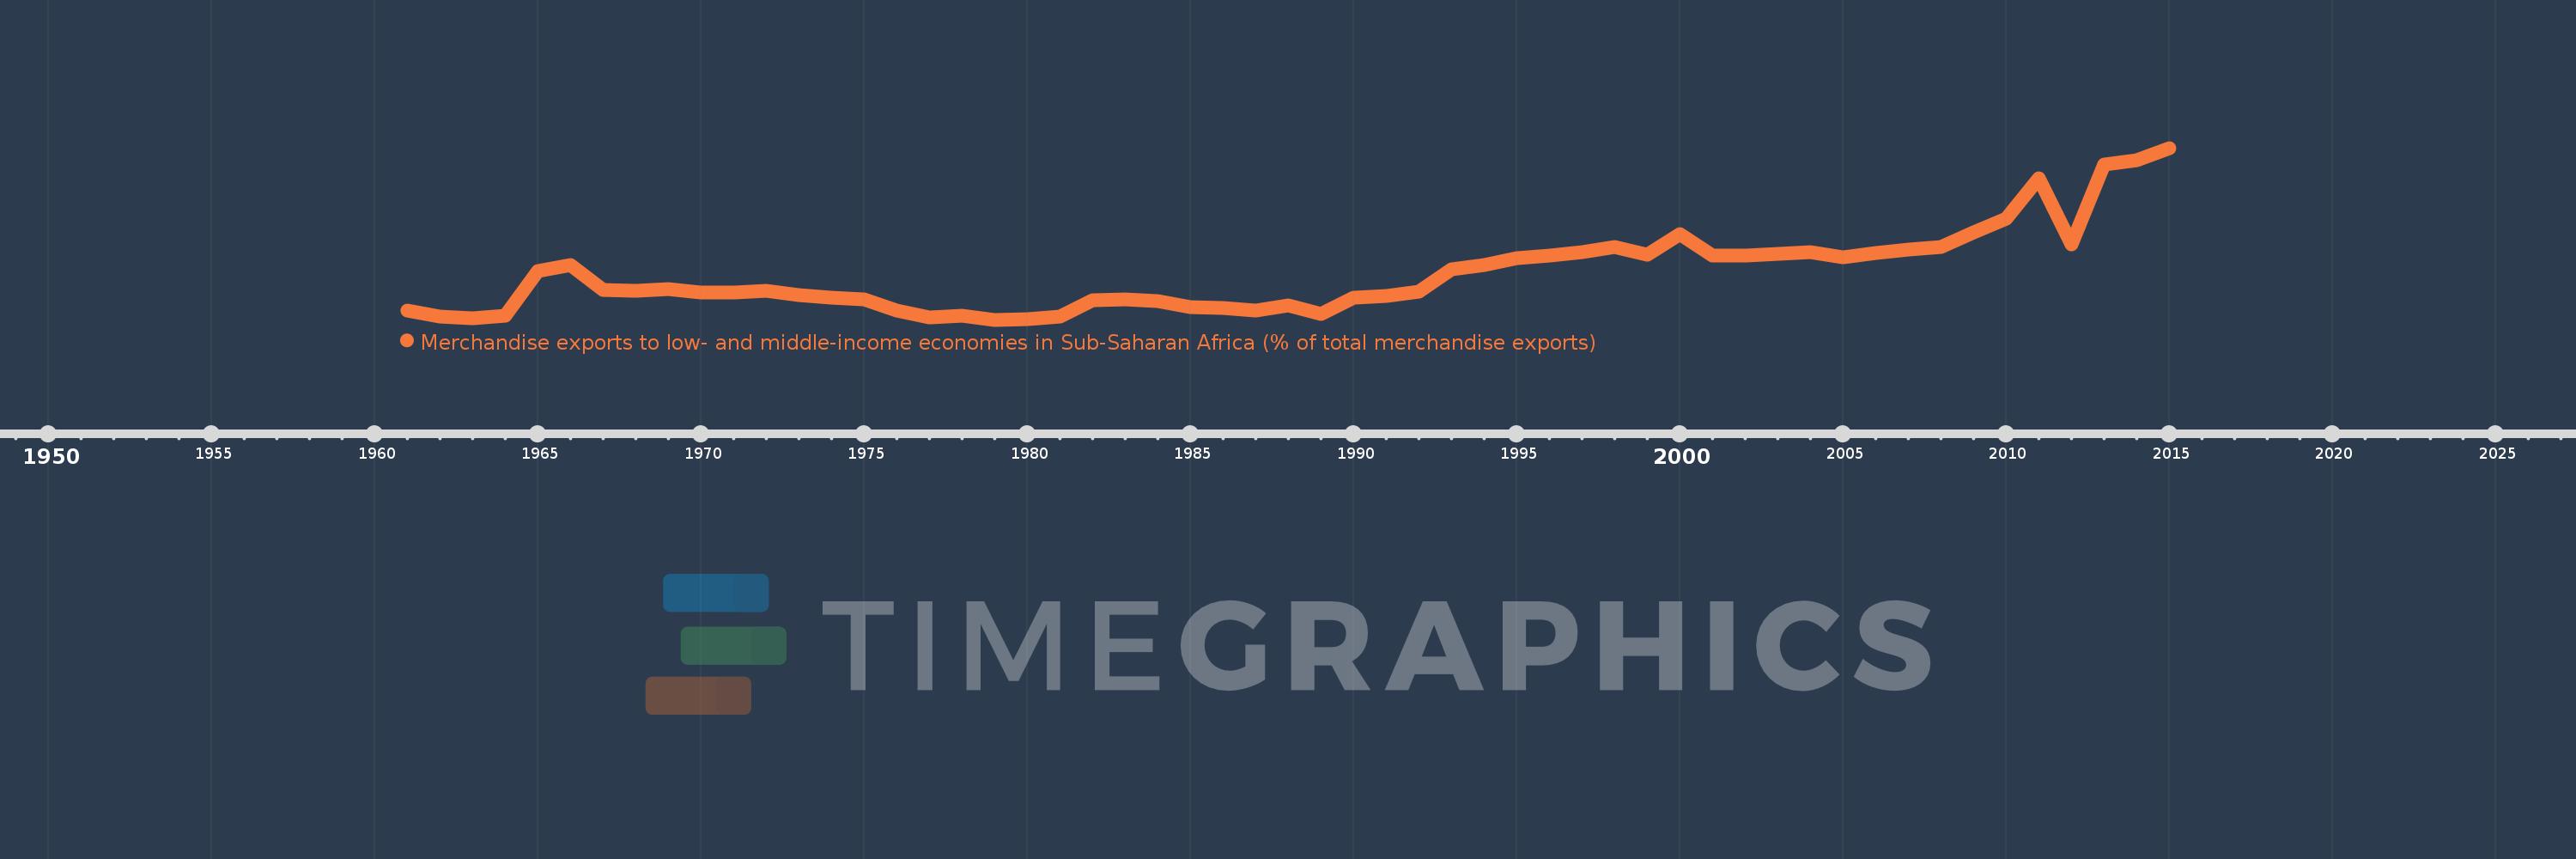
Merchandise exports to low- and middle-income economies in Sub-Saharan Africa (% of total merchandise exports)
2015,2014,2013,2012,2011,2010,2009,2008,2007,2006,2005,2004,2003,2002,2001,2000,1999,1998,1997,1996,1995,1994,1993,1992,1991,1990,1989,1988,1987,1986,1985,1984,1983,1982,1981,1980,1979,1978,1977,1976,1975,1974,1973,1972,1971,1970,1969,1968,1967,1966,1965,1964,1963,1962,1961
This statistics in other country:
AfghanistanAlbaniaAlgeriaAngolaArab WorldArgentinaArmeniaAustraliaAustriaAzerbaijanBahamas, TheBahrainBangladeshBarbadosBelarusBelgiumBelizeBeninBermudaBoliviaBrazilBulgariaBurkina FasoBurundiCabo VerdeCambodiaCameroonCanadaCaribbean small statesCentral African RepublicCentral Europe and the BalticsChadChileChinaColombiaCongo, Dem. Rep.Congo, Rep.Costa RicaCote d'IvoireCroatiaCubaCyprusCzech RepublicDenmarkDjiboutiDominicaDominican RepublicEarly-demographic dividendEast Asia & PacificEast Asia & Pacific (excluding high income)East Asia & Pacific (IDA & IBRD countries)EcuadorEgypt, Arab Rep.EstoniaEthiopiaEuro areaEurope & Central AsiaEurope & Central Asia (excluding high income)Europe & Central Asia (IDA & IBRD countries)European UnionFijiFinlandFragile and conflict affected situationsFranceGabonGambia, TheGeorgiaGermanyGhanaGibraltarGreeceGreenlandGuatemalaGuineaGuinea-BissauGuyanaHaitiHeavily indebted poor countries (HIPC)High incomeHondurasHong Kong SAR, ChinaHungaryIBRD onlyIcelandIDA & IBRD totalIDA blendIDA onlyIDA totalIndiaIndonesiaIran, Islamic Rep.IraqIrelandIsraelItalyJamaicaJapanJordanKazakhstanKenyaKorea, Dem. People’s Rep.Korea, Rep.KuwaitLao PDRLate-demographic dividendLatin America & Caribbean Latin America & Caribbean (excluding high income)Latin America & the Caribbean (IDA & IBRD countries)LatviaLeast developed countries: UN classificationLebanonLiberiaLibyaLithuaniaLow & middle incomeLow incomeLower middle incomeLuxembourgMacao SAR, ChinaMacedonia, FYRMadagascarMalawiMalaysiaMaliMaltaMauritaniaMauritiusMexicoMiddle East & North AfricaMiddle East & North Africa (excluding high income)Middle East & North Africa (IDA & IBRD countries)Middle incomeMoldovaMontenegroMoroccoMozambiqueMyanmarNetherlandsNew ZealandNicaraguaNigerNigeriaNorth AmericaNorwayOECD membersOmanOther small statesPacific island small statesPakistanPanamaPapua New GuineaParaguayPeruPhilippinesPolandPortugalPost-demographic dividendPre-demographic dividendQatarRomaniaRussian FederationRwandaSaudi ArabiaSenegalSerbiaSeychellesSierra LeoneSingaporeSlovak RepublicSloveniaSmall statesSomaliaSouth AfricaSouth AsiaSouth Asia (IDA & IBRD)SpainSri LankaSt. LuciaSt. Vincent and the GrenadinesSub-Saharan Africa Sub-Saharan Africa (excluding high income)Sub-Saharan Africa (IDA & IBRD countries)SudanSurinameSwedenSwitzerlandSyrian Arab RepublicTanzaniaThailandTogoTrinidad and TobagoTunisiaTurkeyUgandaUkraineUnited Arab EmiratesUnited KingdomUnited StatesUpper middle incomeUruguayVenezuela, RBVietnamWorldYemen, Rep.ZambiaZimbabwe Timeline:
This timeline shows a graph from 1961 to 2015 of South Africa. No data until 1960. Number of actual observations by date: 55.
Source name:
World Development Indicators
Source organization:
World Bank staff estimates based data from International Monetary Fund's Direction of Trade database.
Categories, topics:
Private Sector, Trade
Last updated:
apr 23, 2017
Indicators value changes by year
Maximum:
29.728
jan 1, 2015
At the date of observation
Value
Absolute change
Change from previous value
jan 1, 1961
4.157
+4.157
0.0%
jan 1, 1962
3.209
-0.948
-22.81%
jan 1, 1963
2.938
-0.271
-8.44%
jan 1, 1964
3.291
+0.352
12.0%
jan 1, 1965
10.272
+6.981
212.15%
jan 1, 1966
11.227
+0.954
9.29%
jan 1, 1967
7.292
-3.934
-35.05%
jan 1, 1968
7.156
-0.136
-1.87%
jan 1, 1969
7.487
+0.331
4.63%
jan 1, 1970
6.948
-0.54
-7.21%
jan 1, 1971
6.979
+0.032
0.46%
jan 1, 1972
7.214
+0.235
3.36%
jan 1, 1973
6.555
-0.658
-9.13%
jan 1, 1974
6.167
-0.388
-5.92%
jan 1, 1975
5.835
-0.332
-5.38%
jan 1, 1976
4.098
-1.737
-29.77%
jan 1, 1977
3.041
-1.057
-25.8%
jan 1, 1978
3.32
+0.279
9.17%
jan 1, 1979
2.641
-0.679
-20.45%
jan 1, 1980
2.742
+0.101
3.83%
jan 1, 1981
3.085
+0.343
12.49%
jan 1, 1982
5.724
+2.639
85.55%
jan 1, 1983
5.792
+0.069
1.2%
jan 1, 1984
5.516
-0.277
-4.78%
jan 1, 1985
4.595
-0.921
-16.7%
jan 1, 1986
4.441
-0.154
-3.35%
jan 1, 1987
4.116
-0.325
-7.32%
jan 1, 1988
4.842
+0.726
17.65%
jan 1, 1989
3.481
-1.361
-28.11%
jan 1, 1990
6.126
+2.645
75.99%
jan 1, 1991
6.344
+0.217
3.55%
jan 1, 1992
7.126
+0.783
12.34%
jan 1, 1993
10.566
+3.44
48.27%
jan 1, 1994
11.219
+0.653
6.18%
jan 1, 1995
12.337
+1.118
9.97%
jan 1, 1996
12.751
+0.414
3.35%
jan 1, 1997
13.306
+0.555
4.35%
jan 1, 1998
14.068
+0.762
5.73%
jan 1, 1999
12.952
-1.115
-7.93%
jan 1, 2000
16.143
+3.191
24.64%
jan 1, 2001
12.769
-3.374
-20.9%
jan 1, 2002
12.813
+0.044
0.34%
jan 1, 2003
13.092
+0.28
2.18%
jan 1, 2004
13.306
+0.214
1.63%
jan 1, 2005
12.494
-0.811
-6.1%
jan 1, 2006
13.119
+0.624
5.0%
jan 1, 2007
13.761
+0.642
4.89%
jan 1, 2008
14.069
+0.308
2.24%
jan 1, 2009
16.461
+2.393
17.01%
jan 1, 2010
18.632
+2.171
13.19%
jan 1, 2011
24.977
+6.345
34.05%
jan 1, 2012
14.504
-10.473
-41.93%
jan 1, 2013
27.056
+12.552
86.54%
jan 1, 2014
27.805
+0.749
2.77%
jan 1, 2015
29.728
+1.923
6.92%
Ranking of countries by current statistics by years


Comments: