29
/
en
AIzaSyAYiBZKx7MnpbEhh9jyipgxe19OcubqV5w
April 1, 2024
61822
Upper middle income
UMC
false
2
1
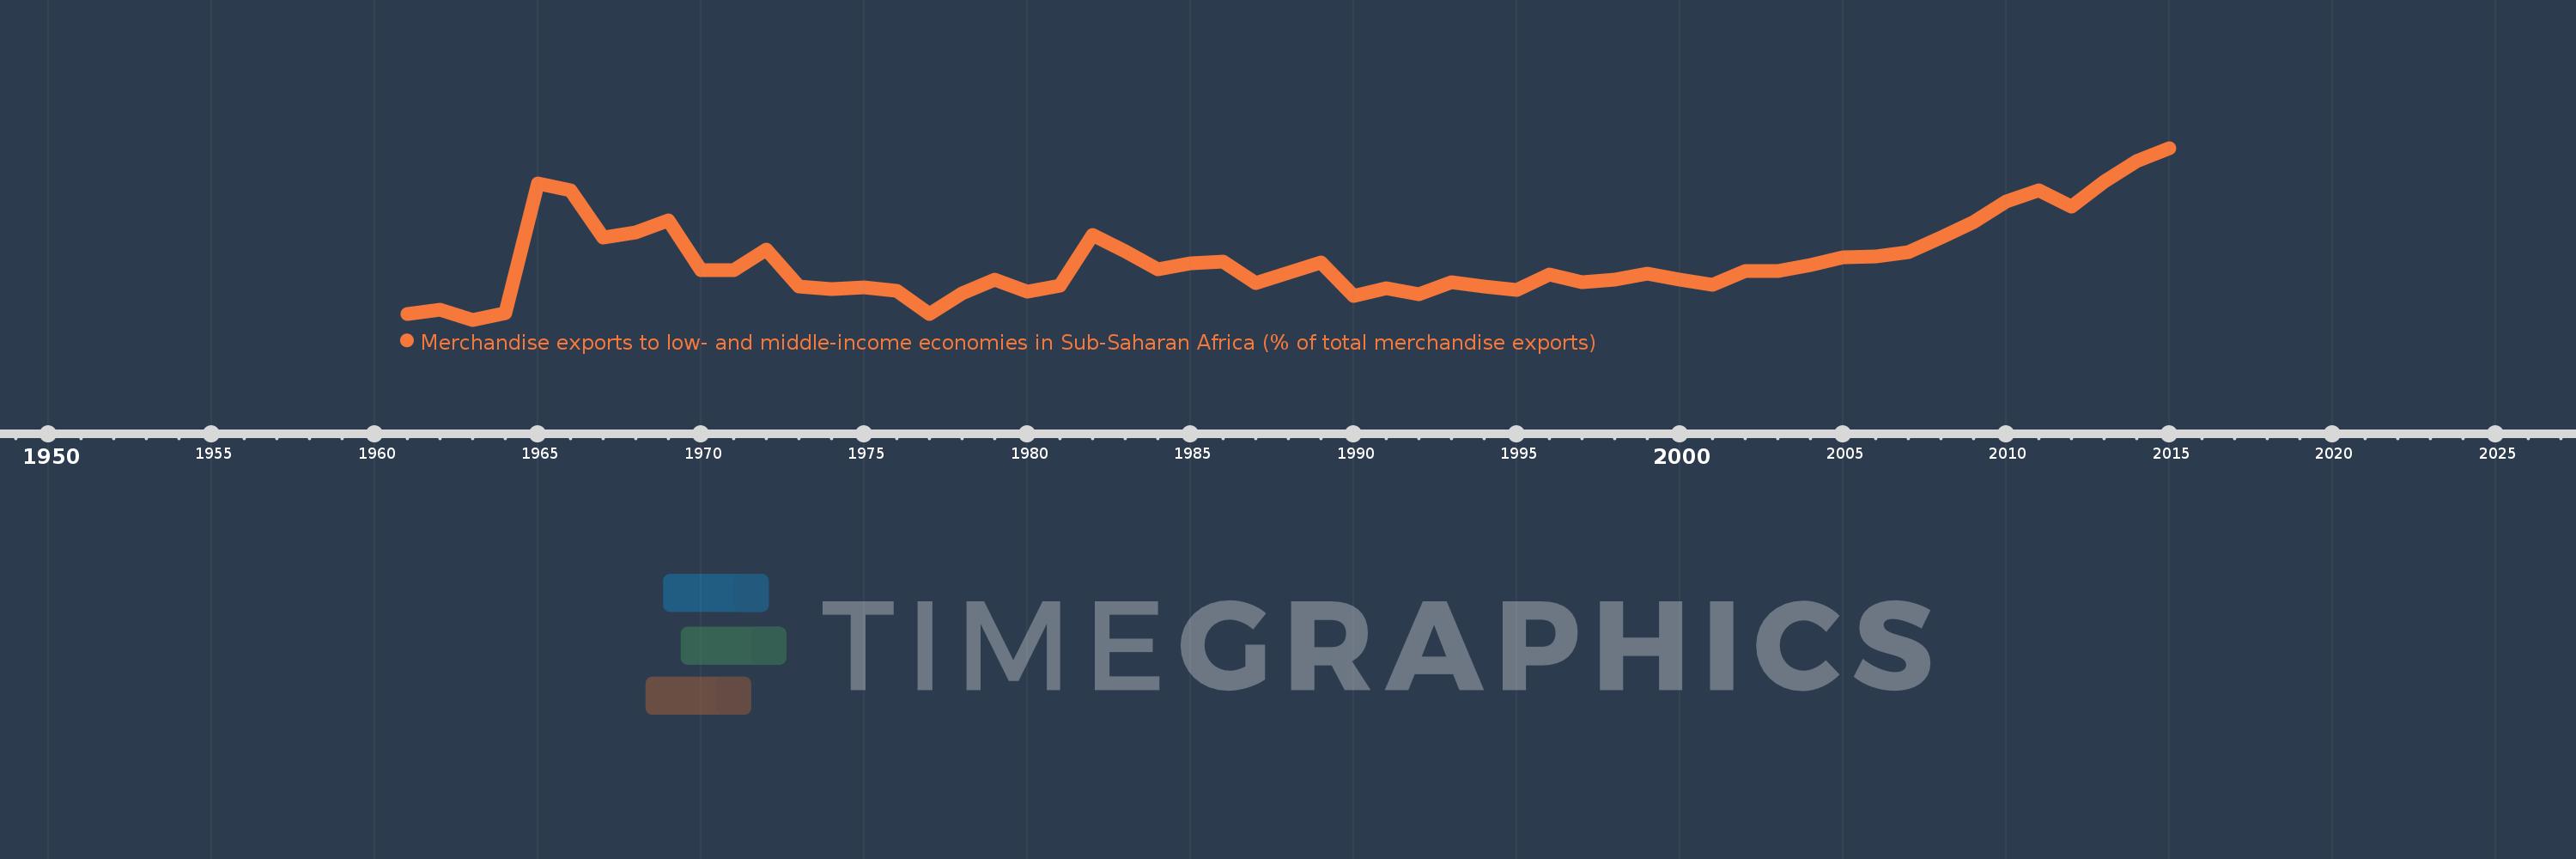
Merchandise exports to low- and middle-income economies in Sub-Saharan Africa (% of total merchandise exports)
2015,2014,2013,2012,2011,2010,2009,2008,2007,2006,2005,2004,2003,2002,2001,2000,1999,1998,1997,1996,1995,1994,1993,1992,1991,1990,1989,1988,1987,1986,1985,1984,1983,1982,1981,1980,1979,1978,1977,1976,1975,1974,1973,1972,1971,1970,1969,1968,1967,1966,1965,1964,1963,1962,1961
This statistics in other country:
AfghanistanAlbaniaAlgeriaAngolaArab WorldArgentinaArmeniaAustraliaAustriaAzerbaijanBahamas, TheBahrainBangladeshBarbadosBelarusBelgiumBelizeBeninBermudaBoliviaBrazilBulgariaBurkina FasoBurundiCabo VerdeCambodiaCameroonCanadaCaribbean small statesCentral African RepublicCentral Europe and the BalticsChadChileChinaColombiaCongo, Dem. Rep.Congo, Rep.Costa RicaCote d'IvoireCroatiaCubaCyprusCzech RepublicDenmarkDjiboutiDominicaDominican RepublicEarly-demographic dividendEast Asia & PacificEast Asia & Pacific (excluding high income)East Asia & Pacific (IDA & IBRD countries)EcuadorEgypt, Arab Rep.EstoniaEthiopiaEuro areaEurope & Central AsiaEurope & Central Asia (excluding high income)Europe & Central Asia (IDA & IBRD countries)European UnionFijiFinlandFragile and conflict affected situationsFranceGabonGambia, TheGeorgiaGermanyGhanaGibraltarGreeceGreenlandGuatemalaGuineaGuinea-BissauGuyanaHaitiHeavily indebted poor countries (HIPC)High incomeHondurasHong Kong SAR, ChinaHungaryIBRD onlyIcelandIDA & IBRD totalIDA blendIDA onlyIDA totalIndiaIndonesiaIran, Islamic Rep.IraqIrelandIsraelItalyJamaicaJapanJordanKazakhstanKenyaKorea, Dem. People’s Rep.Korea, Rep.KuwaitLao PDRLate-demographic dividendLatin America & Caribbean Latin America & Caribbean (excluding high income)Latin America & the Caribbean (IDA & IBRD countries)LatviaLeast developed countries: UN classificationLebanonLiberiaLibyaLithuaniaLow & middle incomeLow incomeLower middle incomeLuxembourgMacao SAR, ChinaMacedonia, FYRMadagascarMalawiMalaysiaMaliMaltaMauritaniaMauritiusMexicoMiddle East & North AfricaMiddle East & North Africa (excluding high income)Middle East & North Africa (IDA & IBRD countries)Middle incomeMoldovaMontenegroMoroccoMozambiqueMyanmarNetherlandsNew ZealandNicaraguaNigerNigeriaNorth AmericaNorwayOECD membersOmanOther small statesPacific island small statesPakistanPanamaPapua New GuineaParaguayPeruPhilippinesPolandPortugalPost-demographic dividendPre-demographic dividendQatarRomaniaRussian FederationRwandaSaudi ArabiaSenegalSerbiaSeychellesSierra LeoneSingaporeSlovak RepublicSloveniaSmall statesSomaliaSouth AfricaSouth AsiaSouth Asia (IDA & IBRD)SpainSri LankaSt. LuciaSt. Vincent and the GrenadinesSub-Saharan Africa Sub-Saharan Africa (excluding high income)Sub-Saharan Africa (IDA & IBRD countries)SudanSurinameSwedenSwitzerlandSyrian Arab RepublicTanzaniaThailandTogoTrinidad and TobagoTunisiaTurkeyUgandaUkraineUnited Arab EmiratesUnited KingdomUnited StatesUpper middle incomeUruguayVenezuela, RBVietnamWorldYemen, Rep.ZambiaZimbabwe Timeline:
This timeline shows a graph from 1961 to 2015 of Upper middle income. No data until 1960. Number of actual observations by date: 55.
Source name:
World Development Indicators
Source organization:
World Bank staff estimates based data from International Monetary Fund's Direction of Trade database.
Categories, topics:
Private Sector, Trade
Last updated:
apr 23, 2017
Indicators value changes by year
At the date of observation
Value
Absolute change
Change from previous value
jan 1, 1961
0.865
+0.865
0.0%
jan 1, 1962
0.924
+0.059
6.79%
jan 1, 1963
0.794
-0.13
-14.03%
jan 1, 1964
0.877
+0.083
10.4%
jan 1, 1965
2.502
+1.625
185.38%
jan 1, 1966
2.413
-0.088
-3.53%
jan 1, 1967
1.824
-0.589
-24.4%
jan 1, 1968
1.892
+0.067
3.69%
jan 1, 1969
2.043
+0.152
8.01%
jan 1, 1970
1.419
-0.625
-30.58%
jan 1, 1971
1.415
-0.004
-0.27%
jan 1, 1972
1.671
+0.256
18.13%
jan 1, 1973
1.207
-0.464
-27.79%
jan 1, 1974
1.179
-0.028
-2.31%
jan 1, 1975
1.196
+0.018
1.49%
jan 1, 1976
1.16
-0.036
-3.04%
jan 1, 1977
0.87
-0.29
-25.04%
jan 1, 1978
1.125
+0.255
29.33%
jan 1, 1979
1.296
+0.171
15.21%
jan 1, 1980
1.151
-0.145
-11.19%
jan 1, 1981
1.223
+0.072
6.27%
jan 1, 1982
1.861
+0.638
52.14%
jan 1, 1983
1.649
-0.212
-11.37%
jan 1, 1984
1.423
-0.226
-13.7%
jan 1, 1985
1.501
+0.078
5.51%
jan 1, 1986
1.524
+0.023
1.5%
jan 1, 1987
1.257
-0.267
-17.53%
jan 1, 1988
1.383
+0.126
10.03%
jan 1, 1989
1.512
+0.13
9.37%
jan 1, 1990
1.091
-0.421
-27.85%
jan 1, 1991
1.19
+0.099
9.1%
jan 1, 1992
1.118
-0.073
-6.1%
jan 1, 1993
1.263
+0.145
12.99%
jan 1, 1994
1.208
-0.055
-4.37%
jan 1, 1995
1.164
-0.044
-3.62%
jan 1, 1996
1.358
+0.194
16.67%
jan 1, 1997
1.265
-0.093
-6.87%
jan 1, 1998
1.292
+0.028
2.18%
jan 1, 1999
1.377
+0.085
6.56%
jan 1, 2000
1.295
-0.082
-5.93%
jan 1, 2001
1.231
-0.064
-4.95%
jan 1, 2002
1.407
+0.176
14.28%
jan 1, 2003
1.4
-0.007
-0.51%
jan 1, 2004
1.483
+0.083
5.92%
jan 1, 2005
1.581
+0.098
6.61%
jan 1, 2006
1.586
+0.005
0.31%
jan 1, 2007
1.643
+0.058
3.64%
jan 1, 2008
1.824
+0.18
10.97%
jan 1, 2009
2.014
+0.19
10.41%
jan 1, 2010
2.279
+0.266
13.19%
jan 1, 2011
2.414
+0.135
5.94%
jan 1, 2012
2.216
-0.198
-8.22%
jan 1, 2013
2.525
+0.309
13.95%
jan 1, 2014
2.789
+0.264
10.45%
jan 1, 2015
2.949
+0.16
5.75%
Ranking of countries by current statistics by years


Comments: