29
/
en
AIzaSyAYiBZKx7MnpbEhh9jyipgxe19OcubqV5w
April 1, 2024
44105
Least developed countries: UN classification
LDC
false
2
1
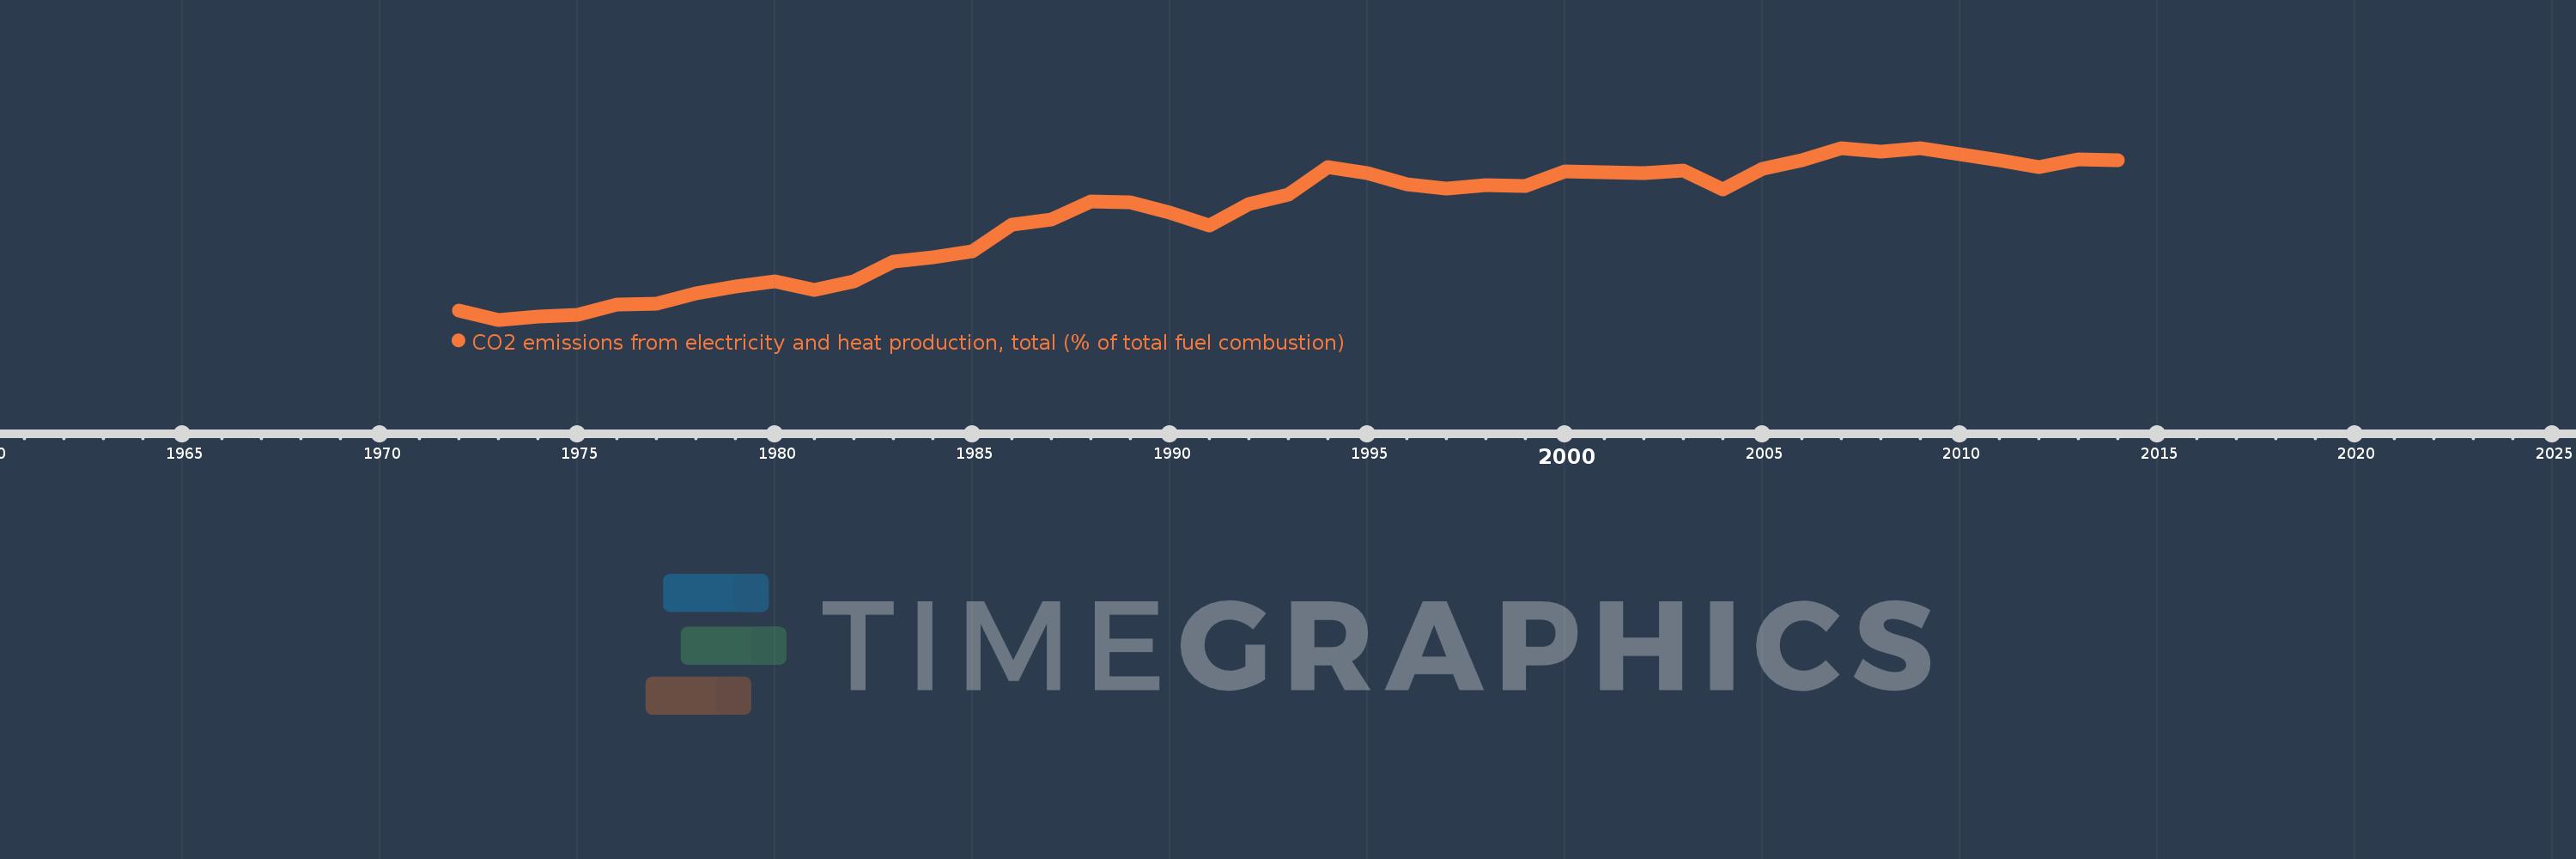
CO2 emissions from electricity and heat production, total (% of total fuel combustion)
2014,2013,2012,2011,2010,2009,2008,2007,2006,2005,2004,2003,2002,2001,2000,1999,1998,1997,1996,1995,1994,1993,1992,1991,1990,1989,1988,1987,1986,1985,1984,1983,1982,1981,1980,1979,1978,1977,1976,1975,1974,1973,1972
This statistics in other country:
AlbaniaAlgeriaAngolaArab WorldArgentinaArmeniaAustraliaAustriaAzerbaijanBahrainBangladeshBelarusBelgiumBeninBoliviaBosnia and HerzegovinaBotswanaBrazilBrunei DarussalamBulgariaCambodiaCameroonCanadaCaribbean small statesCentral Europe and the BalticsChileChinaColombiaCongo, Dem. Rep.Congo, Rep.Costa RicaCote d'IvoireCroatiaCubaCuracaoCyprusCzech RepublicDenmarkDominican RepublicEarly-demographic dividendEast Asia & PacificEast Asia & Pacific (excluding high income)East Asia & Pacific (IDA & IBRD countries)EcuadorEgypt, Arab Rep.El SalvadorEritreaEstoniaEthiopiaEuro areaEurope & Central AsiaEurope & Central Asia (excluding high income)Europe & Central Asia (IDA & IBRD countries)European UnionFinlandFragile and conflict affected situationsFranceGabonGeorgiaGermanyGhanaGibraltarGreeceGuatemalaHaitiHeavily indebted poor countries (HIPC)High incomeHondurasHong Kong SAR, ChinaHungaryIBRD onlyIcelandIDA & IBRD totalIDA blendIDA onlyIDA totalIndiaIndonesiaIran, Islamic Rep.IraqIrelandIsraelItalyJamaicaJapanJordanKazakhstanKenyaKorea, Dem. People’s Rep.Korea, Rep.KosovoKuwaitKyrgyz RepublicLate-demographic dividendLatin America & Caribbean Latin America & Caribbean (excluding high income)Latin America & the Caribbean (IDA & IBRD countries)LatviaLeast developed countries: UN classificationLebanonLibyaLithuaniaLow & middle incomeLow incomeLower middle incomeLuxembourgMacedonia, FYRMalaysiaMaltaMauritiusMexicoMiddle East & North AfricaMiddle East & North Africa (excluding high income)Middle East & North Africa (IDA & IBRD countries)Middle incomeMoldovaMongoliaMontenegroMoroccoMozambiqueMyanmarNamibiaNepalNetherlandsNew ZealandNicaraguaNigerNigeriaNorth AmericaNorwayOECD membersOmanOther small statesPakistanPanamaParaguayPeruPhilippinesPolandPortugalPost-demographic dividendPre-demographic dividendQatarRomaniaRussian FederationSaudi ArabiaSenegalSerbiaSingaporeSlovak RepublicSloveniaSmall statesSouth AfricaSouth AsiaSouth Asia (IDA & IBRD)South SudanSpainSri LankaSub-Saharan Africa Sub-Saharan Africa (excluding high income)Sub-Saharan Africa (IDA & IBRD countries)SudanSwedenSwitzerlandSyrian Arab RepublicTajikistanTanzaniaThailandTogoTrinidad and TobagoTunisiaTurkeyTurkmenistanUkraineUnited Arab EmiratesUnited KingdomUnited StatesUpper middle incomeUruguayUzbekistanVenezuela, RBVietnamWorldYemen, Rep.ZambiaZimbabwe Timeline:
This timeline shows a graph from 1972 to 2014 of Least developed countries: UN classification. No data until 1971. Number of actual observations by date: 43.
Source name:
World Development Indicators
Source organization:
IEA Statistics © OECD/IEA 2014 (http://www.iea.org/stats/index.asp), subject to https://www.iea.org/t&c/termsandconditions/
Categories, topics:
Environment
Last updated:
apr 23, 2017
Indicators value changes by year
Minimum:
14.679
jan 1, 1973
Maximum:
30.551
jan 1, 2009
At the date of observation
Value
Absolute change
Change from previous value
jan 1, 1972
15.561
+15.561
0.0%
jan 1, 1973
14.679
-0.883
-5.67%
jan 1, 1974
14.972
+0.294
2.0%
jan 1, 1975
15.133
+0.161
1.07%
jan 1, 1976
16.045
+0.912
6.02%
jan 1, 1977
16.149
+0.104
0.65%
jan 1, 1978
17.142
+0.993
6.15%
jan 1, 1979
17.757
+0.615
3.59%
jan 1, 1980
18.236
+0.478
2.69%
jan 1, 1981
17.472
-0.763
-4.19%
jan 1, 1982
18.197
+0.725
4.15%
jan 1, 1983
20.067
+1.87
10.28%
jan 1, 1984
20.44
+0.373
1.86%
jan 1, 1985
21.035
+0.595
2.91%
jan 1, 1986
23.492
+2.457
11.68%
jan 1, 1987
23.976
+0.483
2.06%
jan 1, 1988
25.582
+1.606
6.7%
jan 1, 1989
25.527
-0.055
-0.22%
jan 1, 1990
24.604
-0.923
-3.62%
jan 1, 1991
23.406
-1.198
-4.87%
jan 1, 1992
25.374
+1.968
8.41%
jan 1, 1993
26.275
+0.901
3.55%
jan 1, 1994
28.817
+2.541
9.67%
jan 1, 1995
28.212
-0.605
-2.1%
jan 1, 1996
27.193
-1.019
-3.61%
jan 1, 1997
26.784
-0.409
-1.5%
jan 1, 1998
27.147
+0.363
1.36%
jan 1, 1999
27.043
-0.104
-0.38%
jan 1, 2000
28.414
+1.371
5.07%
jan 1, 2001
28.3
-0.114
-0.4%
jan 1, 2002
28.231
-0.07
-0.25%
jan 1, 2003
28.476
+0.245
0.87%
jan 1, 2004
26.734
-1.742
-6.12%
jan 1, 2005
28.639
+1.905
7.13%
jan 1, 2006
29.398
+0.759
2.65%
jan 1, 2007
30.534
+1.136
3.86%
jan 1, 2008
30.243
-0.291
-0.95%
jan 1, 2009
30.551
+0.308
1.02%
jan 1, 2010
29.982
-0.569
-1.86%
jan 1, 2011
29.412
-0.57
-1.9%
jan 1, 2012
28.772
-0.64
-2.18%
jan 1, 2013
29.514
+0.742
2.58%
jan 1, 2014
29.391
-0.123
-0.42%
Ranking of countries by current statistics by years


Comments: