29
/
en
AIzaSyAYiBZKx7MnpbEhh9jyipgxe19OcubqV5w
April 1, 2024
195296
Mexico
MEX
true
2
1
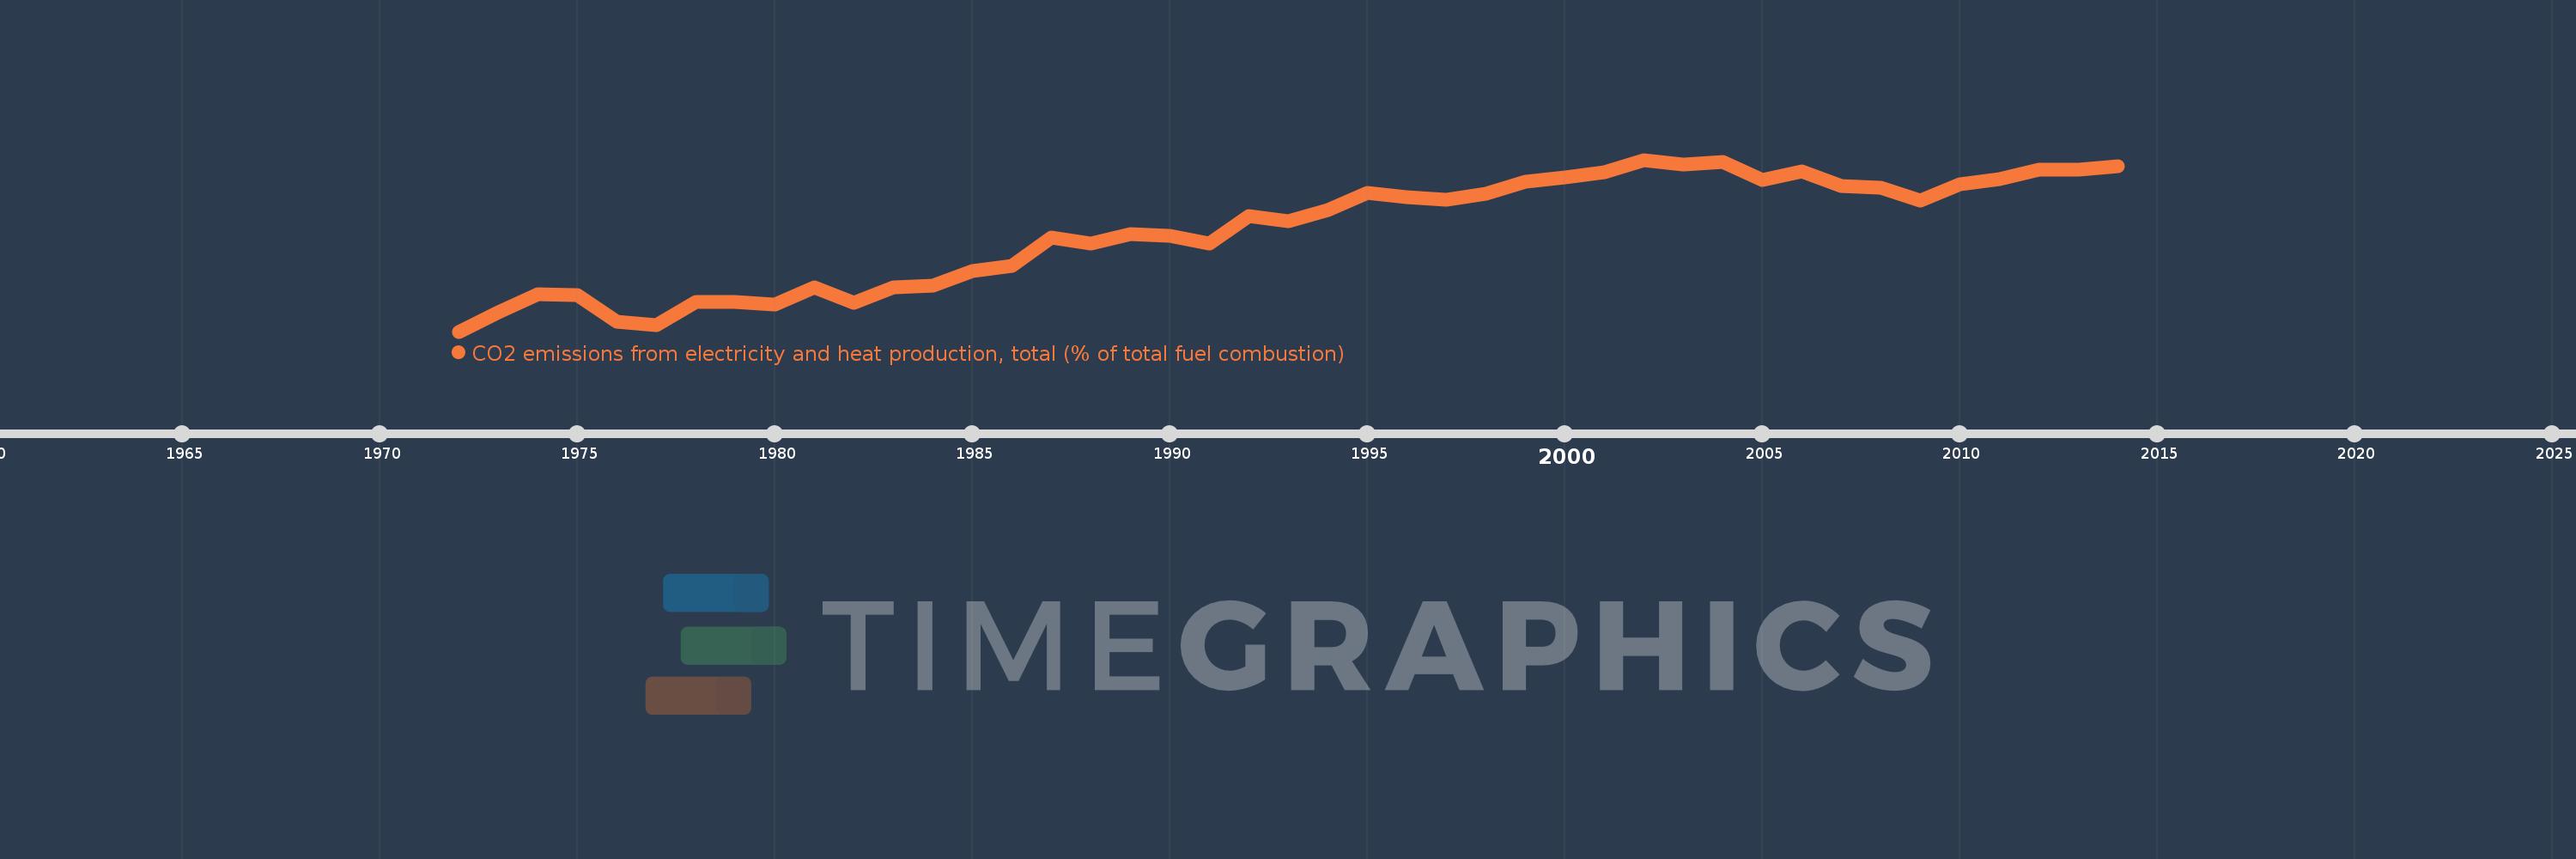
CO2 emissions from electricity and heat production, total (% of total fuel combustion)
2014,2013,2012,2011,2010,2009,2008,2007,2006,2005,2004,2003,2002,2001,2000,1999,1998,1997,1996,1995,1994,1993,1992,1991,1990,1989,1988,1987,1986,1985,1984,1983,1982,1981,1980,1979,1978,1977,1976,1975,1974,1973,1972
This statistics in other country:
AlbaniaAlgeriaAngolaArab WorldArgentinaArmeniaAustraliaAustriaAzerbaijanBahrainBangladeshBelarusBelgiumBeninBoliviaBosnia and HerzegovinaBotswanaBrazilBrunei DarussalamBulgariaCambodiaCameroonCanadaCaribbean small statesCentral Europe and the BalticsChileChinaColombiaCongo, Dem. Rep.Congo, Rep.Costa RicaCote d'IvoireCroatiaCubaCuracaoCyprusCzech RepublicDenmarkDominican RepublicEarly-demographic dividendEast Asia & PacificEast Asia & Pacific (excluding high income)East Asia & Pacific (IDA & IBRD countries)EcuadorEgypt, Arab Rep.El SalvadorEritreaEstoniaEthiopiaEuro areaEurope & Central AsiaEurope & Central Asia (excluding high income)Europe & Central Asia (IDA & IBRD countries)European UnionFinlandFragile and conflict affected situationsFranceGabonGeorgiaGermanyGhanaGibraltarGreeceGuatemalaHaitiHeavily indebted poor countries (HIPC)High incomeHondurasHong Kong SAR, ChinaHungaryIBRD onlyIcelandIDA & IBRD totalIDA blendIDA onlyIDA totalIndiaIndonesiaIran, Islamic Rep.IraqIrelandIsraelItalyJamaicaJapanJordanKazakhstanKenyaKorea, Dem. People’s Rep.Korea, Rep.KosovoKuwaitKyrgyz RepublicLate-demographic dividendLatin America & Caribbean Latin America & Caribbean (excluding high income)Latin America & the Caribbean (IDA & IBRD countries)LatviaLeast developed countries: UN classificationLebanonLibyaLithuaniaLow & middle incomeLow incomeLower middle incomeLuxembourgMacedonia, FYRMalaysiaMaltaMauritiusMexicoMiddle East & North AfricaMiddle East & North Africa (excluding high income)Middle East & North Africa (IDA & IBRD countries)Middle incomeMoldovaMongoliaMontenegroMoroccoMozambiqueMyanmarNamibiaNepalNetherlandsNew ZealandNicaraguaNigerNigeriaNorth AmericaNorwayOECD membersOmanOther small statesPakistanPanamaParaguayPeruPhilippinesPolandPortugalPost-demographic dividendPre-demographic dividendQatarRomaniaRussian FederationSaudi ArabiaSenegalSerbiaSingaporeSlovak RepublicSloveniaSmall statesSouth AfricaSouth AsiaSouth Asia (IDA & IBRD)South SudanSpainSri LankaSub-Saharan Africa Sub-Saharan Africa (excluding high income)Sub-Saharan Africa (IDA & IBRD countries)SudanSwedenSwitzerlandSyrian Arab RepublicTajikistanTanzaniaThailandTogoTrinidad and TobagoTunisiaTurkeyTurkmenistanUkraineUnited Arab EmiratesUnited KingdomUnited StatesUpper middle incomeUruguayUzbekistanVenezuela, RBVietnamWorldYemen, Rep.ZambiaZimbabwe Timeline:
This timeline shows a graph from 1972 to 2014 of Mexico. No data until 1971. Number of actual observations by date: 43.
Source name:
World Development Indicators
Source organization:
IEA Statistics © OECD/IEA 2014 (http://www.iea.org/stats/index.asp), subject to https://www.iea.org/t&c/termsandconditions/
Categories, topics:
Environment
Last updated:
apr 23, 2017
Indicators value changes by year
Minimum:
25.309
jan 1, 1972
Maximum:
45.896
jan 1, 2002
At the date of observation
Value
Absolute change
Change from previous value
jan 1, 1972
25.309
+25.309
0.0%
jan 1, 1973
27.579
+2.27
8.97%
jan 1, 1974
29.821
+2.242
8.13%
jan 1, 1975
29.684
-0.137
-0.46%
jan 1, 1976
26.531
-3.153
-10.62%
jan 1, 1977
26.116
-0.415
-1.57%
jan 1, 1978
28.847
+2.731
10.46%
jan 1, 1979
28.822
-0.026
-0.09%
jan 1, 1980
28.541
-0.281
-0.97%
jan 1, 1981
30.574
+2.033
7.12%
jan 1, 1982
28.727
-1.847
-6.04%
jan 1, 1983
30.625
+1.898
6.61%
jan 1, 1984
30.773
+0.147
0.48%
jan 1, 1985
32.55
+1.777
5.77%
jan 1, 1986
33.172
+0.622
1.91%
jan 1, 1987
36.562
+3.391
10.22%
jan 1, 1988
35.902
-0.66
-1.81%
jan 1, 1989
36.967
+1.065
2.97%
jan 1, 1990
36.739
-0.227
-0.61%
jan 1, 1991
35.847
-0.892
-2.43%
jan 1, 1992
39.15
+3.303
9.21%
jan 1, 1993
38.572
-0.577
-1.48%
jan 1, 1994
39.883
+1.31
3.4%
jan 1, 1995
41.919
+2.037
5.11%
jan 1, 1996
41.434
-0.485
-1.16%
jan 1, 1997
41.141
-0.292
-0.71%
jan 1, 1998
41.86
+0.719
1.75%
jan 1, 1999
43.311
+1.451
3.47%
jan 1, 2000
43.795
+0.483
1.12%
jan 1, 2001
44.417
+0.622
1.42%
jan 1, 2002
45.896
+1.479
3.33%
jan 1, 2003
45.376
-0.52
-1.13%
jan 1, 2004
45.614
+0.239
0.53%
jan 1, 2005
43.46
-2.154
-4.72%
jan 1, 2006
44.482
+1.022
2.35%
jan 1, 2007
42.768
-1.714
-3.85%
jan 1, 2008
42.565
-0.202
-0.47%
jan 1, 2009
40.977
-1.588
-3.73%
jan 1, 2010
42.913
+1.935
4.72%
jan 1, 2011
43.531
+0.618
1.44%
jan 1, 2012
44.69
+1.159
2.66%
jan 1, 2013
44.741
+0.05
0.11%
jan 1, 2014
45.09
+0.35
0.78%
Ranking of countries by current statistics by years


Comments: