29
/
en
AIzaSyAYiBZKx7MnpbEhh9jyipgxe19OcubqV5w
April 1, 2024
176160
Lebanon
LBN
true
2
1
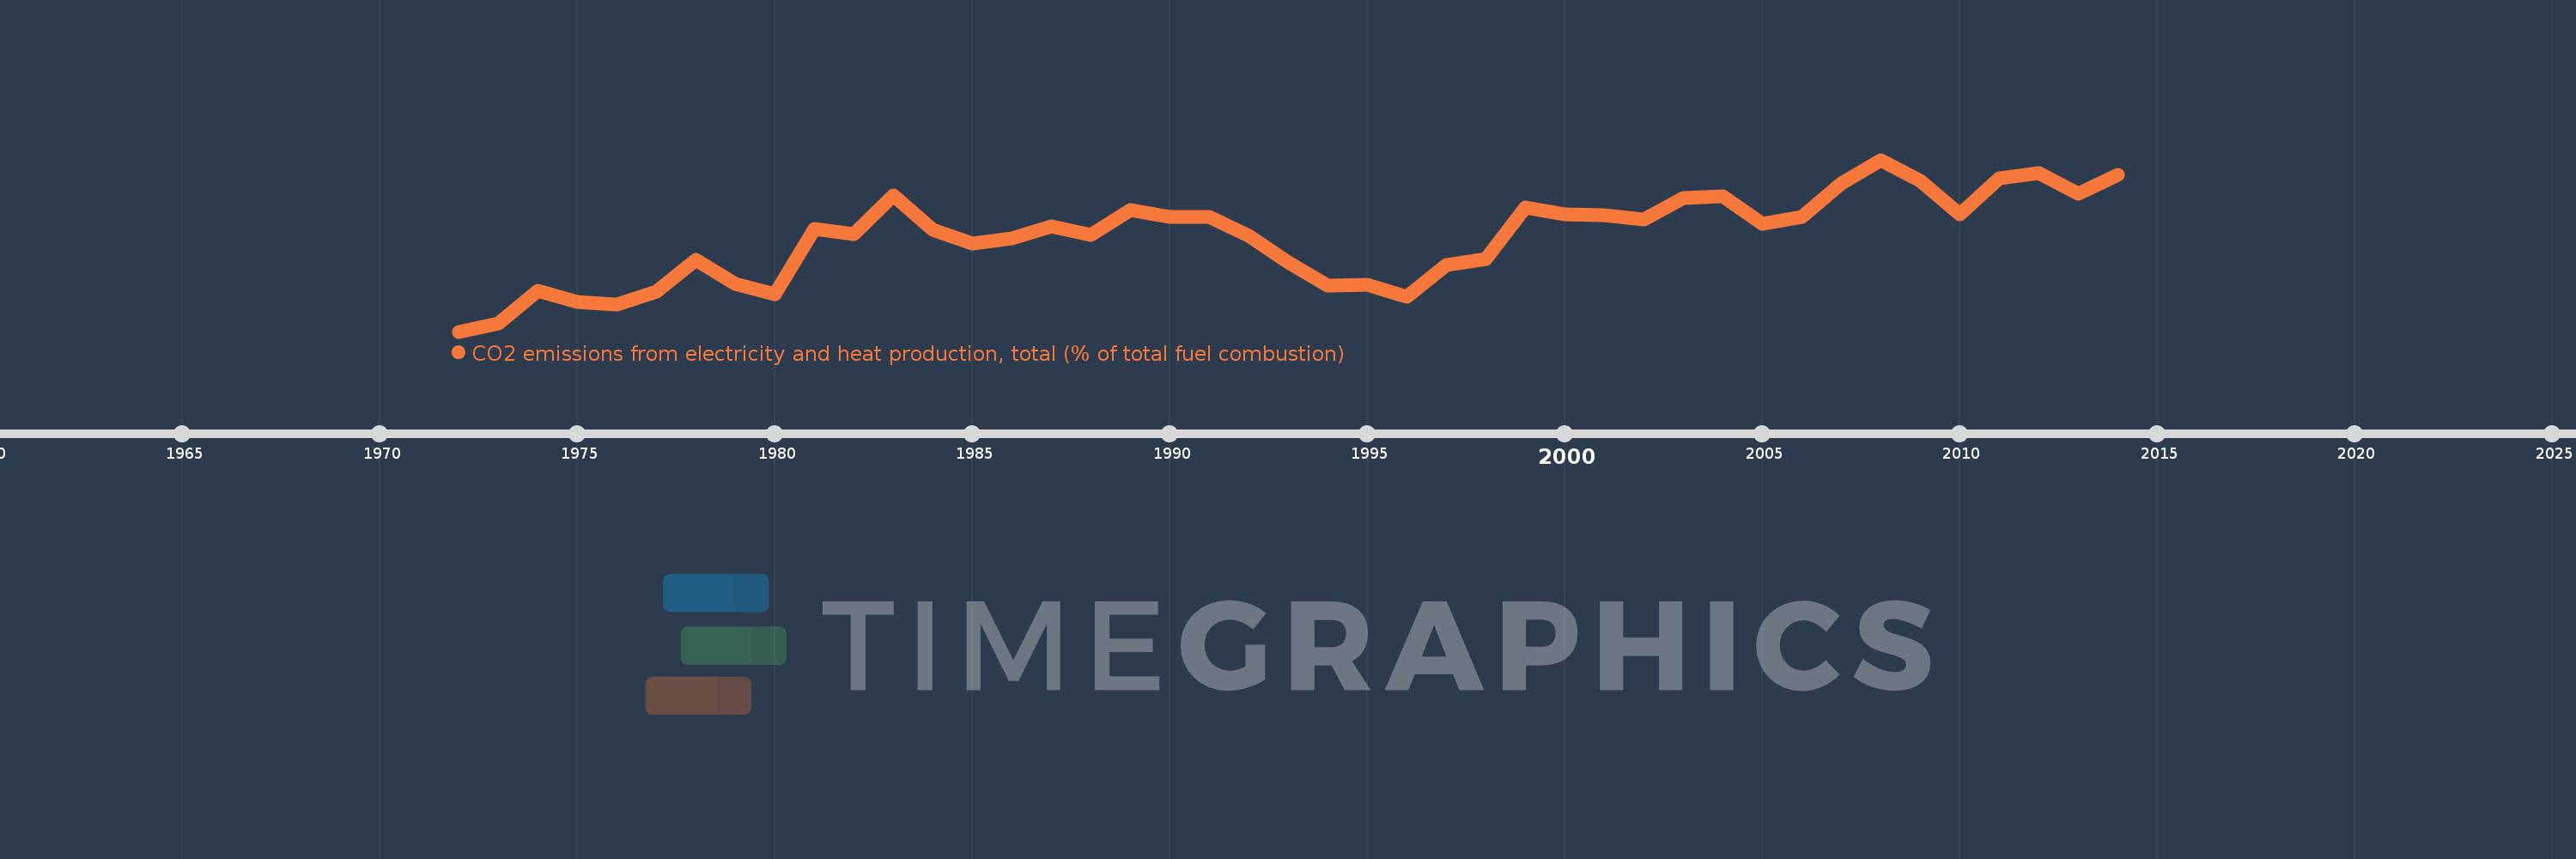
CO2 emissions from electricity and heat production, total (% of total fuel combustion)
2014,2013,2012,2011,2010,2009,2008,2007,2006,2005,2004,2003,2002,2001,2000,1999,1998,1997,1996,1995,1994,1993,1992,1991,1990,1989,1988,1987,1986,1985,1984,1983,1982,1981,1980,1979,1978,1977,1976,1975,1974,1973,1972
This statistics in other country:
AlbaniaAlgeriaAngolaArab WorldArgentinaArmeniaAustraliaAustriaAzerbaijanBahrainBangladeshBelarusBelgiumBeninBoliviaBosnia and HerzegovinaBotswanaBrazilBrunei DarussalamBulgariaCambodiaCameroonCanadaCaribbean small statesCentral Europe and the BalticsChileChinaColombiaCongo, Dem. Rep.Congo, Rep.Costa RicaCote d'IvoireCroatiaCubaCuracaoCyprusCzech RepublicDenmarkDominican RepublicEarly-demographic dividendEast Asia & PacificEast Asia & Pacific (excluding high income)East Asia & Pacific (IDA & IBRD countries)EcuadorEgypt, Arab Rep.El SalvadorEritreaEstoniaEthiopiaEuro areaEurope & Central AsiaEurope & Central Asia (excluding high income)Europe & Central Asia (IDA & IBRD countries)European UnionFinlandFragile and conflict affected situationsFranceGabonGeorgiaGermanyGhanaGibraltarGreeceGuatemalaHaitiHeavily indebted poor countries (HIPC)High incomeHondurasHong Kong SAR, ChinaHungaryIBRD onlyIcelandIDA & IBRD totalIDA blendIDA onlyIDA totalIndiaIndonesiaIran, Islamic Rep.IraqIrelandIsraelItalyJamaicaJapanJordanKazakhstanKenyaKorea, Dem. People’s Rep.Korea, Rep.KosovoKuwaitKyrgyz RepublicLate-demographic dividendLatin America & Caribbean Latin America & Caribbean (excluding high income)Latin America & the Caribbean (IDA & IBRD countries)LatviaLeast developed countries: UN classificationLebanonLibyaLithuaniaLow & middle incomeLow incomeLower middle incomeLuxembourgMacedonia, FYRMalaysiaMaltaMauritiusMexicoMiddle East & North AfricaMiddle East & North Africa (excluding high income)Middle East & North Africa (IDA & IBRD countries)Middle incomeMoldovaMongoliaMontenegroMoroccoMozambiqueMyanmarNamibiaNepalNetherlandsNew ZealandNicaraguaNigerNigeriaNorth AmericaNorwayOECD membersOmanOther small statesPakistanPanamaParaguayPeruPhilippinesPolandPortugalPost-demographic dividendPre-demographic dividendQatarRomaniaRussian FederationSaudi ArabiaSenegalSerbiaSingaporeSlovak RepublicSloveniaSmall statesSouth AfricaSouth AsiaSouth Asia (IDA & IBRD)South SudanSpainSri LankaSub-Saharan Africa Sub-Saharan Africa (excluding high income)Sub-Saharan Africa (IDA & IBRD countries)SudanSwedenSwitzerlandSyrian Arab RepublicTajikistanTanzaniaThailandTogoTrinidad and TobagoTunisiaTurkeyTurkmenistanUkraineUnited Arab EmiratesUnited KingdomUnited StatesUpper middle incomeUruguayUzbekistanVenezuela, RBVietnamWorldYemen, Rep.ZambiaZimbabwe Timeline:
This timeline shows a graph from 1972 to 2014 of Lebanon. No data until 1971. Number of actual observations by date: 43.
Source name:
World Development Indicators
Source organization:
IEA Statistics © OECD/IEA 2014 (http://www.iea.org/stats/index.asp), subject to https://www.iea.org/t&c/termsandconditions/
Categories, topics:
Environment
Last updated:
apr 23, 2017
Indicators value changes by year
Minimum:
18.559
jan 1, 1972
Maximum:
67.027
jan 1, 2008
At the date of observation
Value
Absolute change
Change from previous value
jan 1, 1972
18.559
+18.559
0.0%
jan 1, 1973
20.884
+2.325
12.53%
jan 1, 1974
30.047
+9.163
43.88%
jan 1, 1975
26.965
-3.082
-10.26%
jan 1, 1976
26.27
-0.695
-2.58%
jan 1, 1977
29.905
+3.635
13.84%
jan 1, 1978
38.829
+8.924
29.84%
jan 1, 1979
32.069
-6.76
-17.41%
jan 1, 1980
29.206
-2.863
-8.93%
jan 1, 1981
47.519
+18.312
62.7%
jan 1, 1982
46.13
-1.389
-2.92%
jan 1, 1983
57.051
+10.922
23.68%
jan 1, 1984
47.206
-9.845
-17.26%
jan 1, 1985
43.486
-3.72
-7.88%
jan 1, 1986
44.932
+1.446
3.32%
jan 1, 1987
48.159
+3.227
7.18%
jan 1, 1988
45.781
-2.377
-4.94%
jan 1, 1989
52.834
+7.052
15.4%
jan 1, 1990
50.817
-2.017
-3.82%
jan 1, 1991
50.817
0.0
0.0%
jan 1, 1992
45.612
-5.205
-10.24%
jan 1, 1993
37.971
-7.64
-16.75%
jan 1, 1994
31.584
-6.387
-16.82%
jan 1, 1995
31.859
+0.275
0.87%
jan 1, 1996
28.303
-3.556
-11.16%
jan 1, 1997
37.34
+9.037
31.93%
jan 1, 1998
38.936
+1.596
4.27%
jan 1, 1999
53.598
+14.662
37.66%
jan 1, 2000
51.757
-1.841
-3.43%
jan 1, 2001
51.394
-0.363
-0.7%
jan 1, 2002
50.231
-1.163
-2.26%
jan 1, 2003
56.358
+6.127
12.2%
jan 1, 2004
56.744
+0.387
0.69%
jan 1, 2005
49.045
-7.699
-13.57%
jan 1, 2006
50.83
+1.784
3.64%
jan 1, 2007
60.249
+9.419
18.53%
jan 1, 2008
67.027
+6.779
11.25%
jan 1, 2009
61.002
-6.026
-8.99%
jan 1, 2010
51.738
-9.263
-15.19%
jan 1, 2011
61.813
+10.075
19.47%
jan 1, 2012
63.189
+1.376
2.23%
jan 1, 2013
57.429
-5.761
-9.12%
jan 1, 2014
62.694
+5.265
9.17%
Ranking of countries by current statistics by years


Comments: