29
/
en
AIzaSyAYiBZKx7MnpbEhh9jyipgxe19OcubqV5w
April 1, 2024
125917
El Salvador
SLV
true
2
1
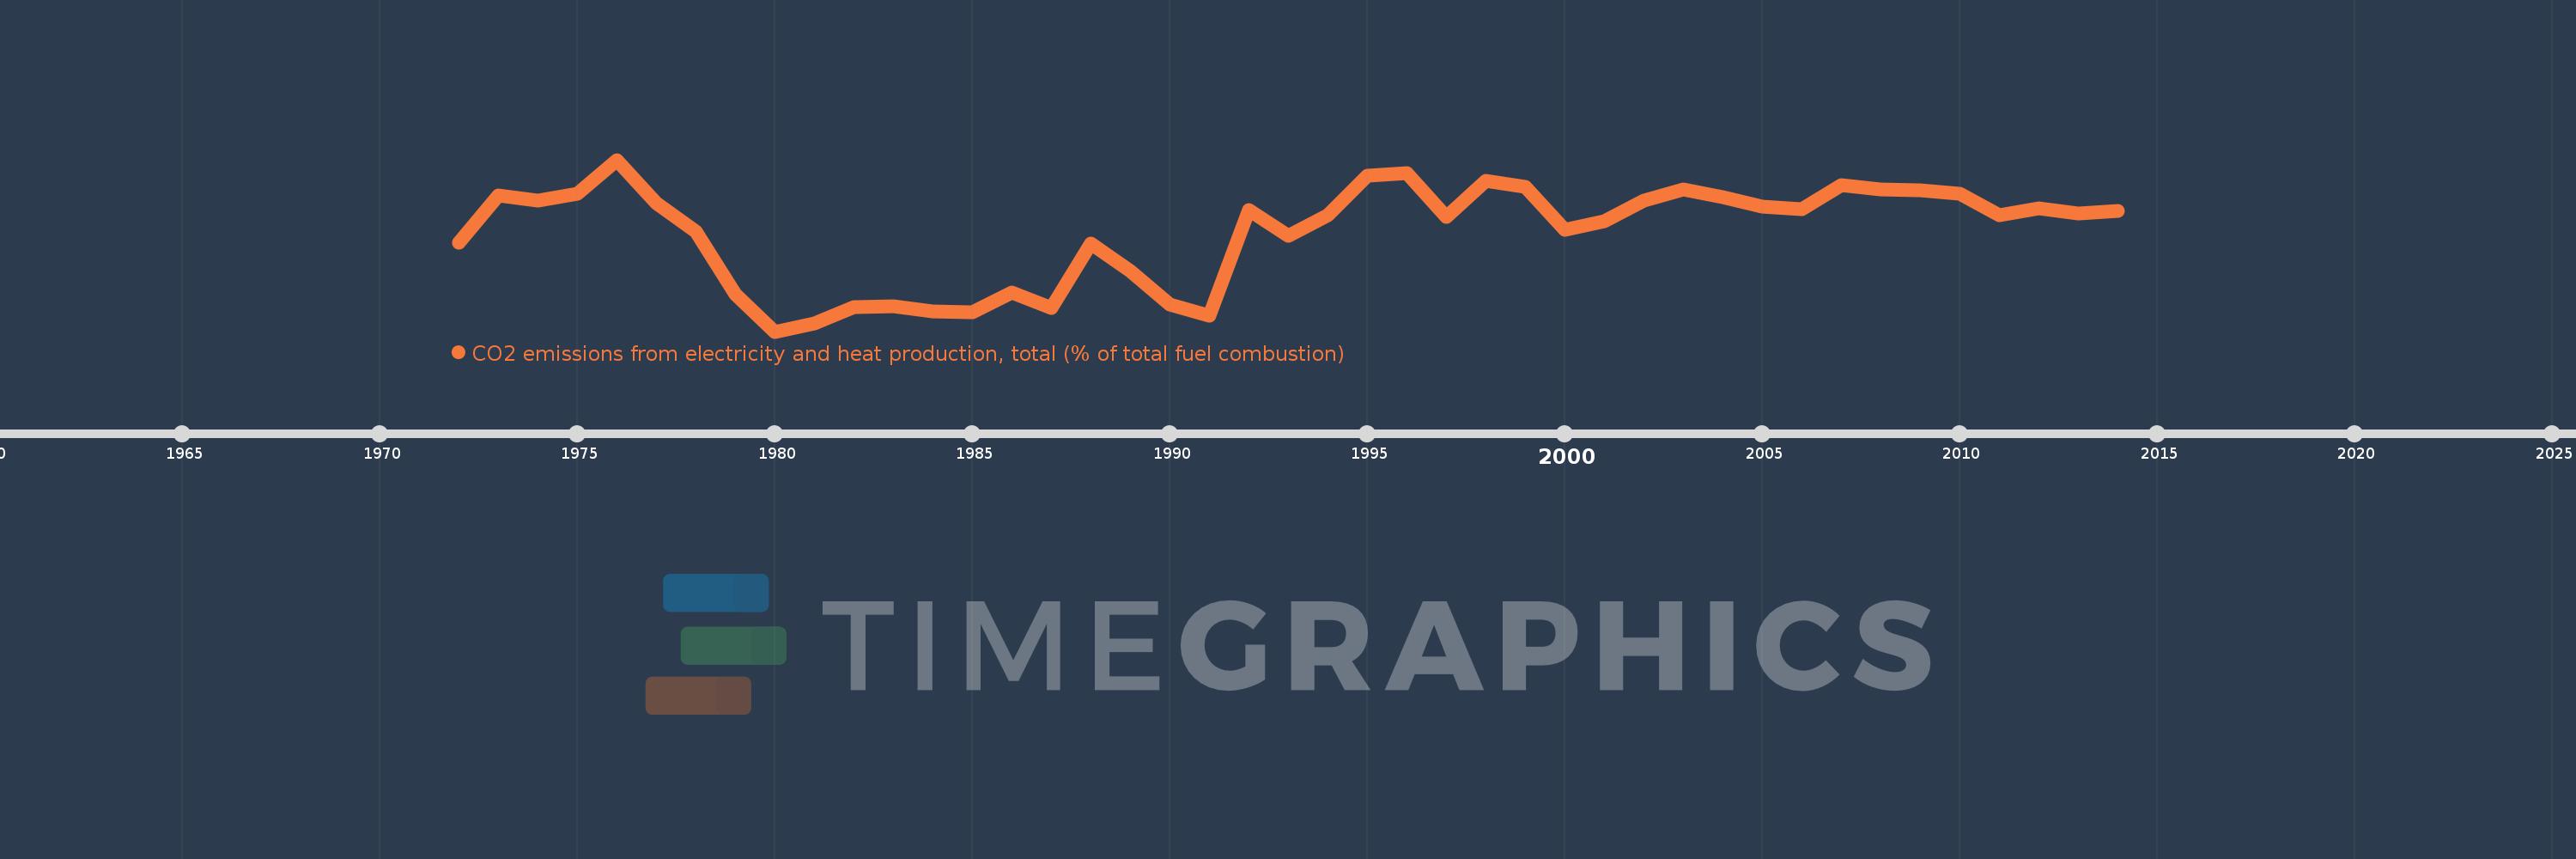
CO2 emissions from electricity and heat production, total (% of total fuel combustion)
2014,2013,2012,2011,2010,2009,2008,2007,2006,2005,2004,2003,2002,2001,2000,1999,1998,1997,1996,1995,1994,1993,1992,1991,1990,1989,1988,1987,1986,1985,1984,1983,1982,1981,1980,1979,1978,1977,1976,1975,1974,1973,1972
This statistics in other country:
AlbaniaAlgeriaAngolaArab WorldArgentinaArmeniaAustraliaAustriaAzerbaijanBahrainBangladeshBelarusBelgiumBeninBoliviaBosnia and HerzegovinaBotswanaBrazilBrunei DarussalamBulgariaCambodiaCameroonCanadaCaribbean small statesCentral Europe and the BalticsChileChinaColombiaCongo, Dem. Rep.Congo, Rep.Costa RicaCote d'IvoireCroatiaCubaCuracaoCyprusCzech RepublicDenmarkDominican RepublicEarly-demographic dividendEast Asia & PacificEast Asia & Pacific (excluding high income)East Asia & Pacific (IDA & IBRD countries)EcuadorEgypt, Arab Rep.El SalvadorEritreaEstoniaEthiopiaEuro areaEurope & Central AsiaEurope & Central Asia (excluding high income)Europe & Central Asia (IDA & IBRD countries)European UnionFinlandFragile and conflict affected situationsFranceGabonGeorgiaGermanyGhanaGibraltarGreeceGuatemalaHaitiHeavily indebted poor countries (HIPC)High incomeHondurasHong Kong SAR, ChinaHungaryIBRD onlyIcelandIDA & IBRD totalIDA blendIDA onlyIDA totalIndiaIndonesiaIran, Islamic Rep.IraqIrelandIsraelItalyJamaicaJapanJordanKazakhstanKenyaKorea, Dem. People’s Rep.Korea, Rep.KosovoKuwaitKyrgyz RepublicLate-demographic dividendLatin America & Caribbean Latin America & Caribbean (excluding high income)Latin America & the Caribbean (IDA & IBRD countries)LatviaLeast developed countries: UN classificationLebanonLibyaLithuaniaLow & middle incomeLow incomeLower middle incomeLuxembourgMacedonia, FYRMalaysiaMaltaMauritiusMexicoMiddle East & North AfricaMiddle East & North Africa (excluding high income)Middle East & North Africa (IDA & IBRD countries)Middle incomeMoldovaMongoliaMontenegroMoroccoMozambiqueMyanmarNamibiaNepalNetherlandsNew ZealandNicaraguaNigerNigeriaNorth AmericaNorwayOECD membersOmanOther small statesPakistanPanamaParaguayPeruPhilippinesPolandPortugalPost-demographic dividendPre-demographic dividendQatarRomaniaRussian FederationSaudi ArabiaSenegalSerbiaSingaporeSlovak RepublicSloveniaSmall statesSouth AfricaSouth AsiaSouth Asia (IDA & IBRD)South SudanSpainSri LankaSub-Saharan Africa Sub-Saharan Africa (excluding high income)Sub-Saharan Africa (IDA & IBRD countries)SudanSwedenSwitzerlandSyrian Arab RepublicTajikistanTanzaniaThailandTogoTrinidad and TobagoTunisiaTurkeyTurkmenistanUkraineUnited Arab EmiratesUnited KingdomUnited StatesUpper middle incomeUruguayUzbekistanVenezuela, RBVietnamWorldYemen, Rep.ZambiaZimbabwe Timeline:
This timeline shows a graph from 1972 to 2014 of El Salvador. No data until 1971. Number of actual observations by date: 43.
Source name:
World Development Indicators
Source organization:
IEA Statistics © OECD/IEA 2014 (http://www.iea.org/stats/index.asp), subject to https://www.iea.org/t&c/termsandconditions/
Categories, topics:
Environment
Last updated:
apr 23, 2017
Indicators value changes by year
Maximum:
31.771
jan 1, 1976
At the date of observation
Value
Absolute change
Change from previous value
jan 1, 1972
19.231
+19.231
0.0%
jan 1, 1973
26.316
+7.085
36.84%
jan 1, 1974
25.595
-0.721
-2.74%
jan 1, 1975
26.627
+1.032
4.03%
jan 1, 1976
31.771
+5.144
19.32%
jan 1, 1977
25.128
-6.643
-20.91%
jan 1, 1978
20.896
-4.233
-16.84%
jan 1, 1979
11.386
-9.509
-45.51%
jan 1, 1980
5.67
-5.716
-50.2%
jan 1, 1981
6.875
+1.205
21.25%
jan 1, 1982
9.333
+2.458
35.76%
jan 1, 1983
9.459
+0.126
1.35%
jan 1, 1984
8.725
-0.735
-7.77%
jan 1, 1985
8.553
-0.172
-1.97%
jan 1, 1986
11.585
+3.033
35.46%
jan 1, 1987
9.259
-2.326
-20.08%
jan 1, 1988
19.0
+9.741
105.2%
jan 1, 1989
14.833
-4.167
-21.93%
jan 1, 1990
9.804
-5.029
-33.9%
jan 1, 1991
8.057
-1.747
-17.82%
jan 1, 1992
24.188
+16.131
200.21%
jan 1, 1993
20.189
-3.998
-16.53%
jan 1, 1994
23.38
+3.191
15.81%
jan 1, 1995
29.34
+5.96
25.49%
jan 1, 1996
29.759
+0.419
1.43%
jan 1, 1997
23.116
-6.644
-22.32%
jan 1, 1998
28.542
+5.427
23.48%
jan 1, 1999
27.639
-0.903
-3.16%
jan 1, 2000
21.124
-6.515
-23.57%
jan 1, 2001
22.437
+1.313
6.22%
jan 1, 2002
25.59
+3.153
14.05%
jan 1, 2003
27.306
+1.716
6.7%
jan 1, 2004
26.058
-1.248
-4.57%
jan 1, 2005
24.621
-1.437
-5.51%
jan 1, 2006
24.32
-0.301
-1.22%
jan 1, 2007
27.914
+3.594
14.78%
jan 1, 2008
27.312
-0.602
-2.16%
jan 1, 2009
27.199
-0.113
-0.42%
jan 1, 2010
26.623
-0.575
-2.12%
jan 1, 2011
23.379
-3.245
-12.19%
jan 1, 2012
24.459
+1.08
4.62%
jan 1, 2013
23.616
-0.844
-3.45%
jan 1, 2014
24.048
+0.433
1.83%
Ranking of countries by current statistics by years


Comments: