29
/
en
AIzaSyAYiBZKx7MnpbEhh9jyipgxe19OcubqV5w
April 1, 2024
133909
France
FRA
true
2
1
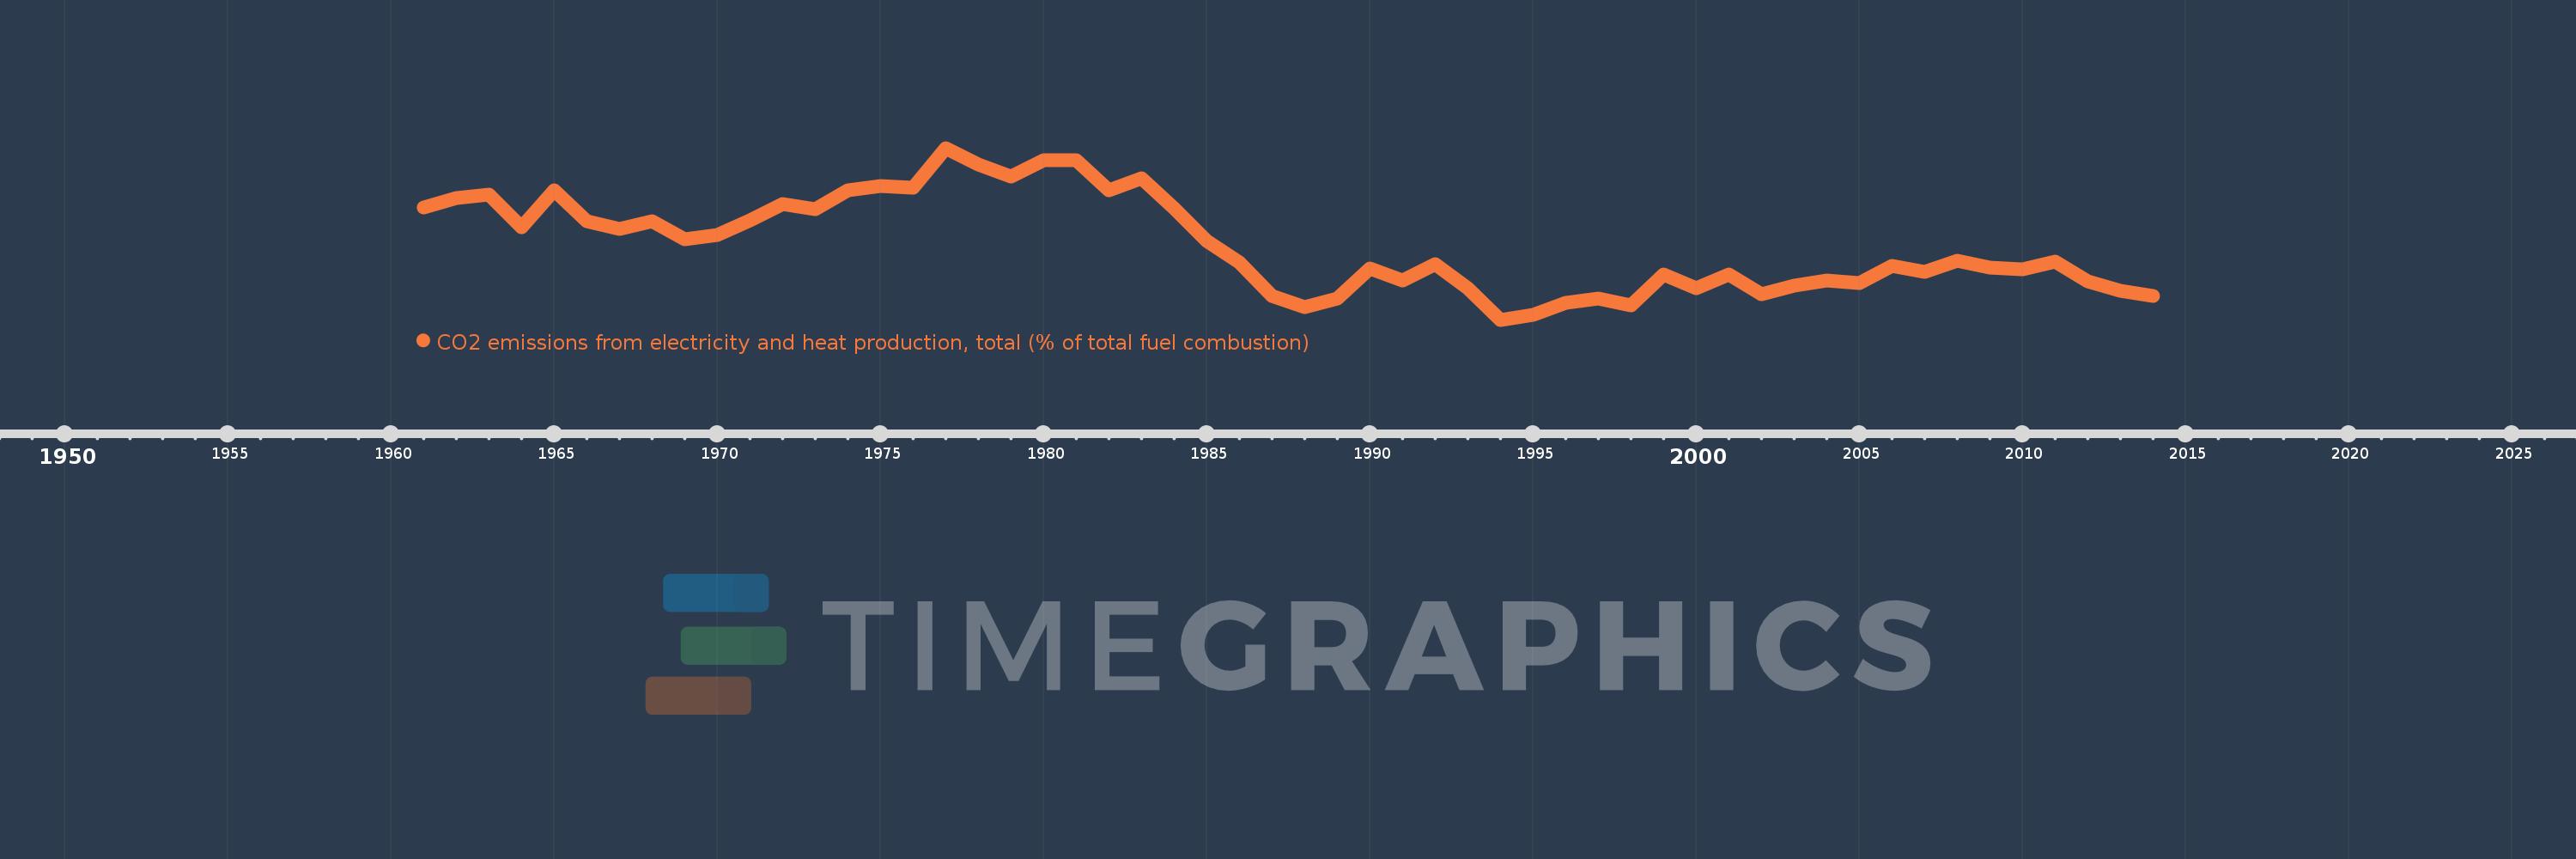
CO2 emissions from electricity and heat production, total (% of total fuel combustion)
2014,2013,2012,2011,2010,2009,2008,2007,2006,2005,2004,2003,2002,2001,2000,1999,1998,1997,1996,1995,1994,1993,1992,1991,1990,1989,1988,1987,1986,1985,1984,1983,1982,1981,1980,1979,1978,1977,1976,1975,1974,1973,1972,1971,1970,1969,1968,1967,1966,1965,1964,1963,1962,1961
This statistics in other country:
AlbaniaAlgeriaAngolaArab WorldArgentinaArmeniaAustraliaAustriaAzerbaijanBahrainBangladeshBelarusBelgiumBeninBoliviaBosnia and HerzegovinaBotswanaBrazilBrunei DarussalamBulgariaCambodiaCameroonCanadaCaribbean small statesCentral Europe and the BalticsChileChinaColombiaCongo, Dem. Rep.Congo, Rep.Costa RicaCote d'IvoireCroatiaCubaCuracaoCyprusCzech RepublicDenmarkDominican RepublicEarly-demographic dividendEast Asia & PacificEast Asia & Pacific (excluding high income)East Asia & Pacific (IDA & IBRD countries)EcuadorEgypt, Arab Rep.El SalvadorEritreaEstoniaEthiopiaEuro areaEurope & Central AsiaEurope & Central Asia (excluding high income)Europe & Central Asia (IDA & IBRD countries)European UnionFinlandFragile and conflict affected situationsFranceGabonGeorgiaGermanyGhanaGibraltarGreeceGuatemalaHaitiHeavily indebted poor countries (HIPC)High incomeHondurasHong Kong SAR, ChinaHungaryIBRD onlyIcelandIDA & IBRD totalIDA blendIDA onlyIDA totalIndiaIndonesiaIran, Islamic Rep.IraqIrelandIsraelItalyJamaicaJapanJordanKazakhstanKenyaKorea, Dem. People’s Rep.Korea, Rep.KosovoKuwaitKyrgyz RepublicLate-demographic dividendLatin America & Caribbean Latin America & Caribbean (excluding high income)Latin America & the Caribbean (IDA & IBRD countries)LatviaLeast developed countries: UN classificationLebanonLibyaLithuaniaLow & middle incomeLow incomeLower middle incomeLuxembourgMacedonia, FYRMalaysiaMaltaMauritiusMexicoMiddle East & North AfricaMiddle East & North Africa (excluding high income)Middle East & North Africa (IDA & IBRD countries)Middle incomeMoldovaMongoliaMontenegroMoroccoMozambiqueMyanmarNamibiaNepalNetherlandsNew ZealandNicaraguaNigerNigeriaNorth AmericaNorwayOECD membersOmanOther small statesPakistanPanamaParaguayPeruPhilippinesPolandPortugalPost-demographic dividendPre-demographic dividendQatarRomaniaRussian FederationSaudi ArabiaSenegalSerbiaSingaporeSlovak RepublicSloveniaSmall statesSouth AfricaSouth AsiaSouth Asia (IDA & IBRD)South SudanSpainSri LankaSub-Saharan Africa Sub-Saharan Africa (excluding high income)Sub-Saharan Africa (IDA & IBRD countries)SudanSwedenSwitzerlandSyrian Arab RepublicTajikistanTanzaniaThailandTogoTrinidad and TobagoTunisiaTurkeyTurkmenistanUkraineUnited Arab EmiratesUnited KingdomUnited StatesUpper middle incomeUruguayUzbekistanVenezuela, RBVietnamWorldYemen, Rep.ZambiaZimbabwe Timeline:
This timeline shows a graph from 1961 to 2014 of France. No data until 1960. Number of actual observations by date: 54.
Source name:
World Development Indicators
Source organization:
IEA Statistics © OECD/IEA 2014 (http://www.iea.org/stats/index.asp), subject to https://www.iea.org/t&c/termsandconditions/
Categories, topics:
Environment
Last updated:
apr 23, 2017
Indicators value changes by year
Minimum:
14.627
jan 1, 1994
Maximum:
31.332
jan 1, 1977
At the date of observation
Value
Absolute change
Change from previous value
jan 1, 1961
25.58
+25.58
0.0%
jan 1, 1962
26.487
+0.907
3.55%
jan 1, 1963
26.778
+0.29
1.1%
jan 1, 1964
23.647
-3.131
-11.69%
jan 1, 1965
27.221
+3.574
15.11%
jan 1, 1966
24.229
-2.992
-10.99%
jan 1, 1967
23.448
-0.781
-3.22%
jan 1, 1968
24.188
+0.74
3.16%
jan 1, 1969
22.462
-1.726
-7.14%
jan 1, 1970
22.838
+0.376
1.67%
jan 1, 1971
24.274
+1.436
6.29%
jan 1, 1972
25.89
+1.616
6.66%
jan 1, 1973
25.358
-0.532
-2.06%
jan 1, 1974
27.202
+1.844
7.27%
jan 1, 1975
27.625
+0.422
1.55%
jan 1, 1976
27.49
-0.134
-0.49%
jan 1, 1977
31.332
+3.842
13.98%
jan 1, 1978
29.755
-1.577
-5.03%
jan 1, 1979
28.576
-1.179
-3.96%
jan 1, 1980
30.122
+1.547
5.41%
jan 1, 1981
30.121
-0.001
0.0%
jan 1, 1982
27.192
-2.929
-9.72%
jan 1, 1983
28.381
+1.189
4.37%
jan 1, 1984
25.488
-2.893
-10.19%
jan 1, 1985
22.297
-3.191
-12.52%
jan 1, 1986
20.165
-2.132
-9.56%
jan 1, 1987
16.953
-3.212
-15.93%
jan 1, 1988
15.867
-1.086
-6.41%
jan 1, 1989
16.677
+0.81
5.11%
jan 1, 1990
19.593
+2.916
17.48%
jan 1, 1991
18.438
-1.154
-5.89%
jan 1, 1992
20.052
+1.614
8.75%
jan 1, 1993
17.702
-2.349
-11.72%
jan 1, 1994
14.627
-3.076
-17.37%
jan 1, 1995
15.113
+0.487
3.33%
jan 1, 1996
16.309
+1.195
7.91%
jan 1, 1997
16.726
+0.417
2.56%
jan 1, 1998
16.051
-0.675
-4.04%
jan 1, 1999
19.053
+3.002
18.7%
jan 1, 2000
17.716
-1.336
-7.01%
jan 1, 2001
19.045
+1.329
7.5%
jan 1, 2002
17.072
-1.973
-10.36%
jan 1, 2003
17.914
+0.842
4.93%
jan 1, 2004
18.452
+0.538
3.0%
jan 1, 2005
18.233
-0.219
-1.19%
jan 1, 2006
19.849
+1.616
8.86%
jan 1, 2007
19.272
-0.577
-2.91%
jan 1, 2008
20.337
+1.065
5.52%
jan 1, 2009
19.706
-0.631
-3.1%
jan 1, 2010
19.541
-0.165
-0.84%
jan 1, 2011
20.316
+0.775
3.97%
jan 1, 2012
18.322
-1.994
-9.82%
jan 1, 2013
17.433
-0.888
-4.85%
jan 1, 2014
16.925
-0.509
-2.92%
Ranking of countries by current statistics by years


Comments: