29
/
en
AIzaSyAYiBZKx7MnpbEhh9jyipgxe19OcubqV5w
April 1, 2024
50710
Middle income
MIC
false
2
1
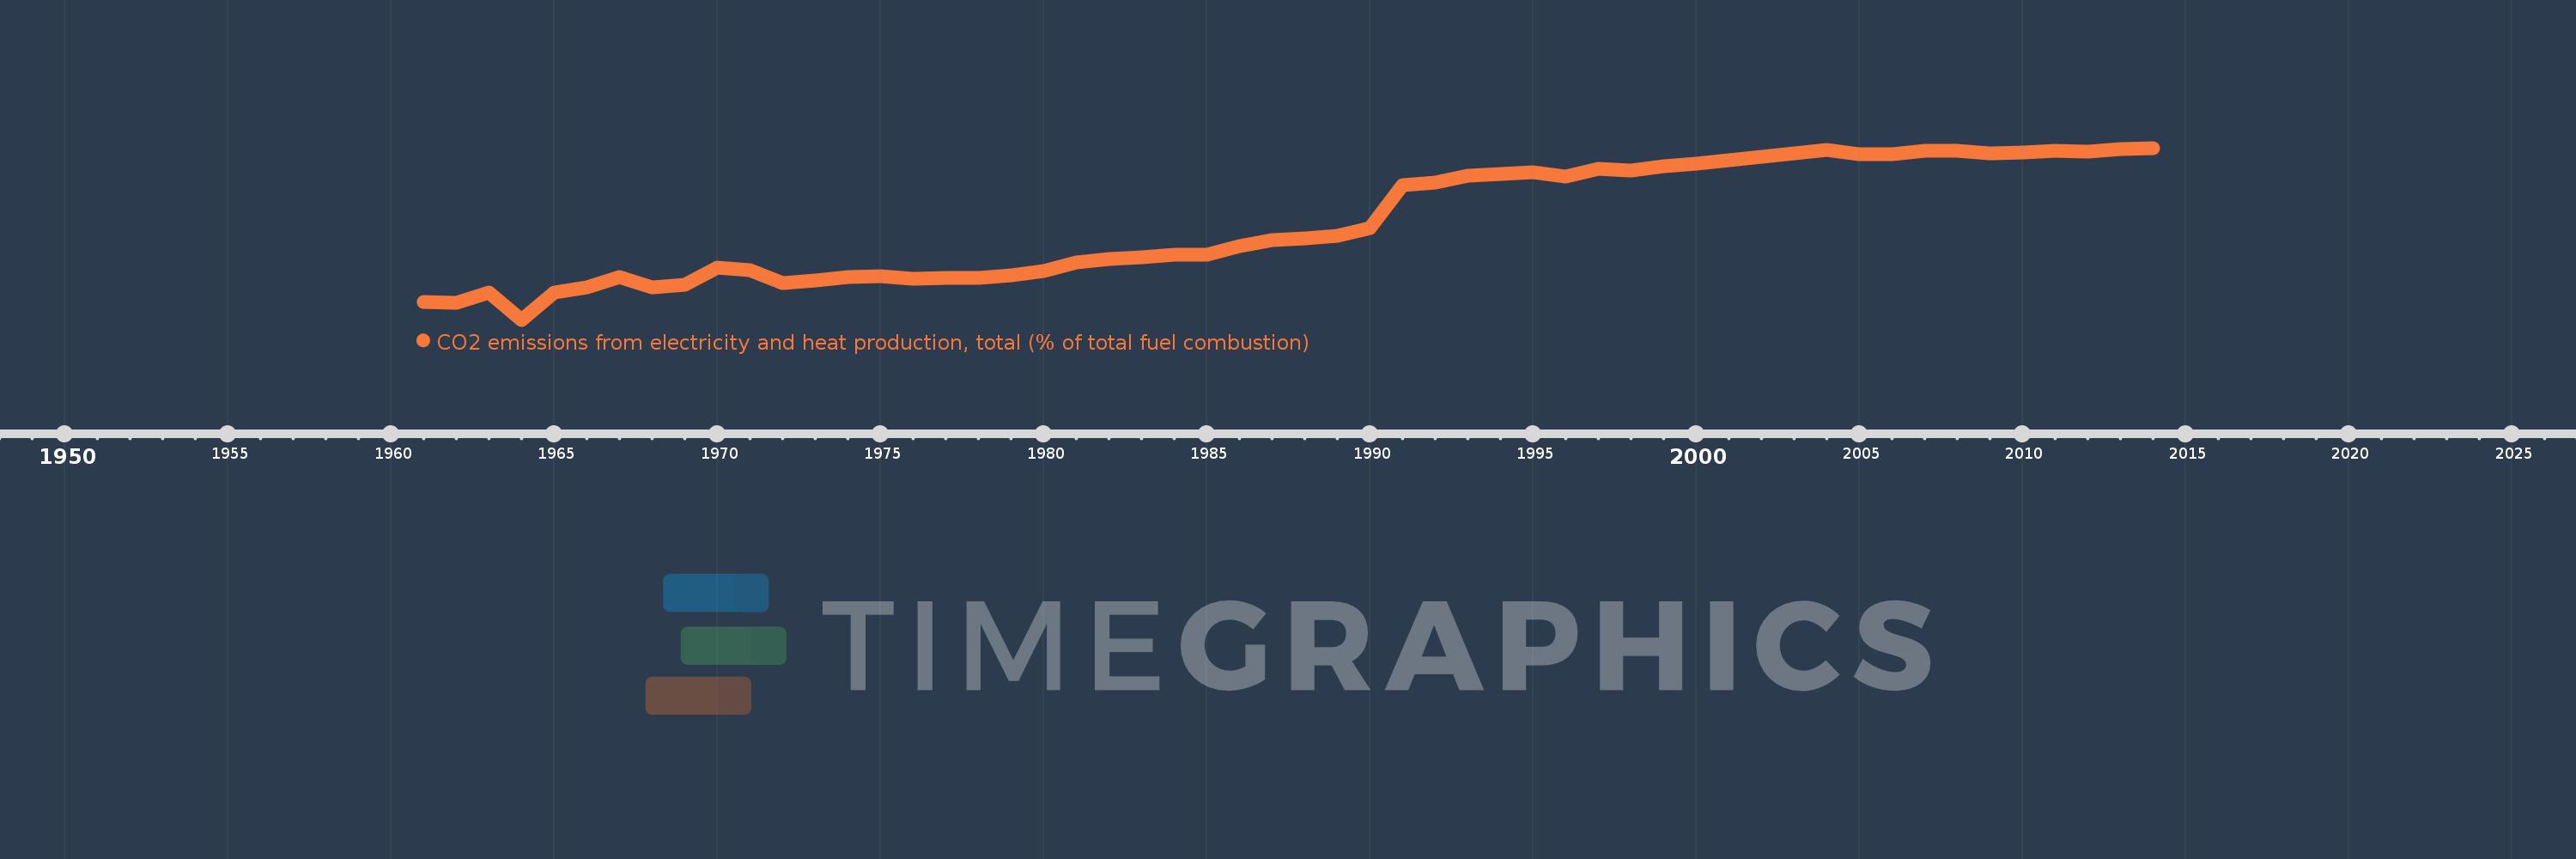
CO2 emissions from electricity and heat production, total (% of total fuel combustion)
2014,2013,2012,2011,2010,2009,2008,2007,2006,2005,2004,2003,2002,2001,2000,1999,1998,1997,1996,1995,1994,1993,1992,1991,1990,1989,1988,1987,1986,1985,1984,1983,1982,1981,1980,1979,1978,1977,1976,1975,1974,1973,1972,1971,1970,1969,1968,1967,1966,1965,1964,1963,1962,1961
This statistics in other country:
AlbaniaAlgeriaAngolaArab WorldArgentinaArmeniaAustraliaAustriaAzerbaijanBahrainBangladeshBelarusBelgiumBeninBoliviaBosnia and HerzegovinaBotswanaBrazilBrunei DarussalamBulgariaCambodiaCameroonCanadaCaribbean small statesCentral Europe and the BalticsChileChinaColombiaCongo, Dem. Rep.Congo, Rep.Costa RicaCote d'IvoireCroatiaCubaCuracaoCyprusCzech RepublicDenmarkDominican RepublicEarly-demographic dividendEast Asia & PacificEast Asia & Pacific (excluding high income)East Asia & Pacific (IDA & IBRD countries)EcuadorEgypt, Arab Rep.El SalvadorEritreaEstoniaEthiopiaEuro areaEurope & Central AsiaEurope & Central Asia (excluding high income)Europe & Central Asia (IDA & IBRD countries)European UnionFinlandFragile and conflict affected situationsFranceGabonGeorgiaGermanyGhanaGibraltarGreeceGuatemalaHaitiHeavily indebted poor countries (HIPC)High incomeHondurasHong Kong SAR, ChinaHungaryIBRD onlyIcelandIDA & IBRD totalIDA blendIDA onlyIDA totalIndiaIndonesiaIran, Islamic Rep.IraqIrelandIsraelItalyJamaicaJapanJordanKazakhstanKenyaKorea, Dem. People’s Rep.Korea, Rep.KosovoKuwaitKyrgyz RepublicLate-demographic dividendLatin America & Caribbean Latin America & Caribbean (excluding high income)Latin America & the Caribbean (IDA & IBRD countries)LatviaLeast developed countries: UN classificationLebanonLibyaLithuaniaLow & middle incomeLow incomeLower middle incomeLuxembourgMacedonia, FYRMalaysiaMaltaMauritiusMexicoMiddle East & North AfricaMiddle East & North Africa (excluding high income)Middle East & North Africa (IDA & IBRD countries)Middle incomeMoldovaMongoliaMontenegroMoroccoMozambiqueMyanmarNamibiaNepalNetherlandsNew ZealandNicaraguaNigerNigeriaNorth AmericaNorwayOECD membersOmanOther small statesPakistanPanamaParaguayPeruPhilippinesPolandPortugalPost-demographic dividendPre-demographic dividendQatarRomaniaRussian FederationSaudi ArabiaSenegalSerbiaSingaporeSlovak RepublicSloveniaSmall statesSouth AfricaSouth AsiaSouth Asia (IDA & IBRD)South SudanSpainSri LankaSub-Saharan Africa Sub-Saharan Africa (excluding high income)Sub-Saharan Africa (IDA & IBRD countries)SudanSwedenSwitzerlandSyrian Arab RepublicTajikistanTanzaniaThailandTogoTrinidad and TobagoTunisiaTurkeyTurkmenistanUkraineUnited Arab EmiratesUnited KingdomUnited StatesUpper middle incomeUruguayUzbekistanVenezuela, RBVietnamWorldYemen, Rep.ZambiaZimbabwe Timeline:
This timeline shows a graph from 1961 to 2014 of Middle income. No data until 1960. Number of actual observations by date: 54.
Source name:
World Development Indicators
Source organization:
IEA Statistics © OECD/IEA 2014 (http://www.iea.org/stats/index.asp), subject to https://www.iea.org/t&c/termsandconditions/
Categories, topics:
Environment
Last updated:
apr 23, 2017
Indicators value changes by year
Minimum:
16.215
jan 1, 1964
Maximum:
50.953
jan 1, 2014
At the date of observation
Value
Absolute change
Change from previous value
jan 1, 1961
19.738
+19.738
0.0%
jan 1, 1962
19.683
-0.055
-0.28%
jan 1, 1963
21.641
+1.957
9.94%
jan 1, 1964
16.215
-5.426
-25.07%
jan 1, 1965
21.673
+5.458
33.66%
jan 1, 1966
22.82
+1.147
5.29%
jan 1, 1967
24.844
+2.024
8.87%
jan 1, 1968
22.718
-2.126
-8.56%
jan 1, 1969
23.267
+0.549
2.42%
jan 1, 1970
26.796
+3.528
15.16%
jan 1, 1971
26.294
-0.502
-1.87%
jan 1, 1972
23.663
-2.63
-10.0%
jan 1, 1973
24.086
+0.423
1.79%
jan 1, 1974
24.866
+0.78
3.24%
jan 1, 1975
24.987
+0.121
0.49%
jan 1, 1976
24.482
-0.505
-2.02%
jan 1, 1977
24.721
+0.239
0.97%
jan 1, 1978
24.743
+0.022
0.09%
jan 1, 1979
25.201
+0.458
1.85%
jan 1, 1980
26.058
+0.857
3.4%
jan 1, 1981
27.729
+1.671
6.41%
jan 1, 1982
28.431
+0.703
2.53%
jan 1, 1983
28.8
+0.369
1.3%
jan 1, 1984
29.305
+0.505
1.75%
jan 1, 1985
29.44
+0.135
0.46%
jan 1, 1986
31.105
+1.665
5.66%
jan 1, 1987
32.374
+1.27
4.08%
jan 1, 1988
32.745
+0.37
1.14%
jan 1, 1989
33.27
+0.525
1.6%
jan 1, 1990
34.73
+1.46
4.39%
jan 1, 1991
43.387
+8.658
24.93%
jan 1, 1992
44.01
+0.623
1.44%
jan 1, 1993
45.289
+1.279
2.91%
jan 1, 1994
45.655
+0.365
0.81%
jan 1, 1995
45.971
+0.317
0.69%
jan 1, 1996
45.161
-0.81
-1.76%
jan 1, 1997
46.815
+1.654
3.66%
jan 1, 1998
46.432
-0.383
-0.82%
jan 1, 1999
47.217
+0.785
1.69%
jan 1, 2000
47.748
+0.531
1.13%
jan 1, 2001
48.512
+0.764
1.6%
jan 1, 2002
49.187
+0.675
1.39%
jan 1, 2003
49.92
+0.733
1.49%
jan 1, 2004
50.582
+0.662
1.33%
jan 1, 2005
49.723
-0.86
-1.7%
jan 1, 2006
49.728
+0.006
0.01%
jan 1, 2007
50.466
+0.738
1.48%
jan 1, 2008
50.419
-0.047
-0.09%
jan 1, 2009
49.92
-0.5
-0.99%
jan 1, 2010
50.029
+0.11
0.22%
jan 1, 2011
50.43
+0.401
0.8%
jan 1, 2012
50.122
-0.308
-0.61%
jan 1, 2013
50.704
+0.582
1.16%
jan 1, 2014
50.953
+0.249
0.49%
Ranking of countries by current statistics by years


Comments: