29
/
en
AIzaSyAYiBZKx7MnpbEhh9jyipgxe19OcubqV5w
April 1, 2024
225696
Portugal
PRT
true
2
1
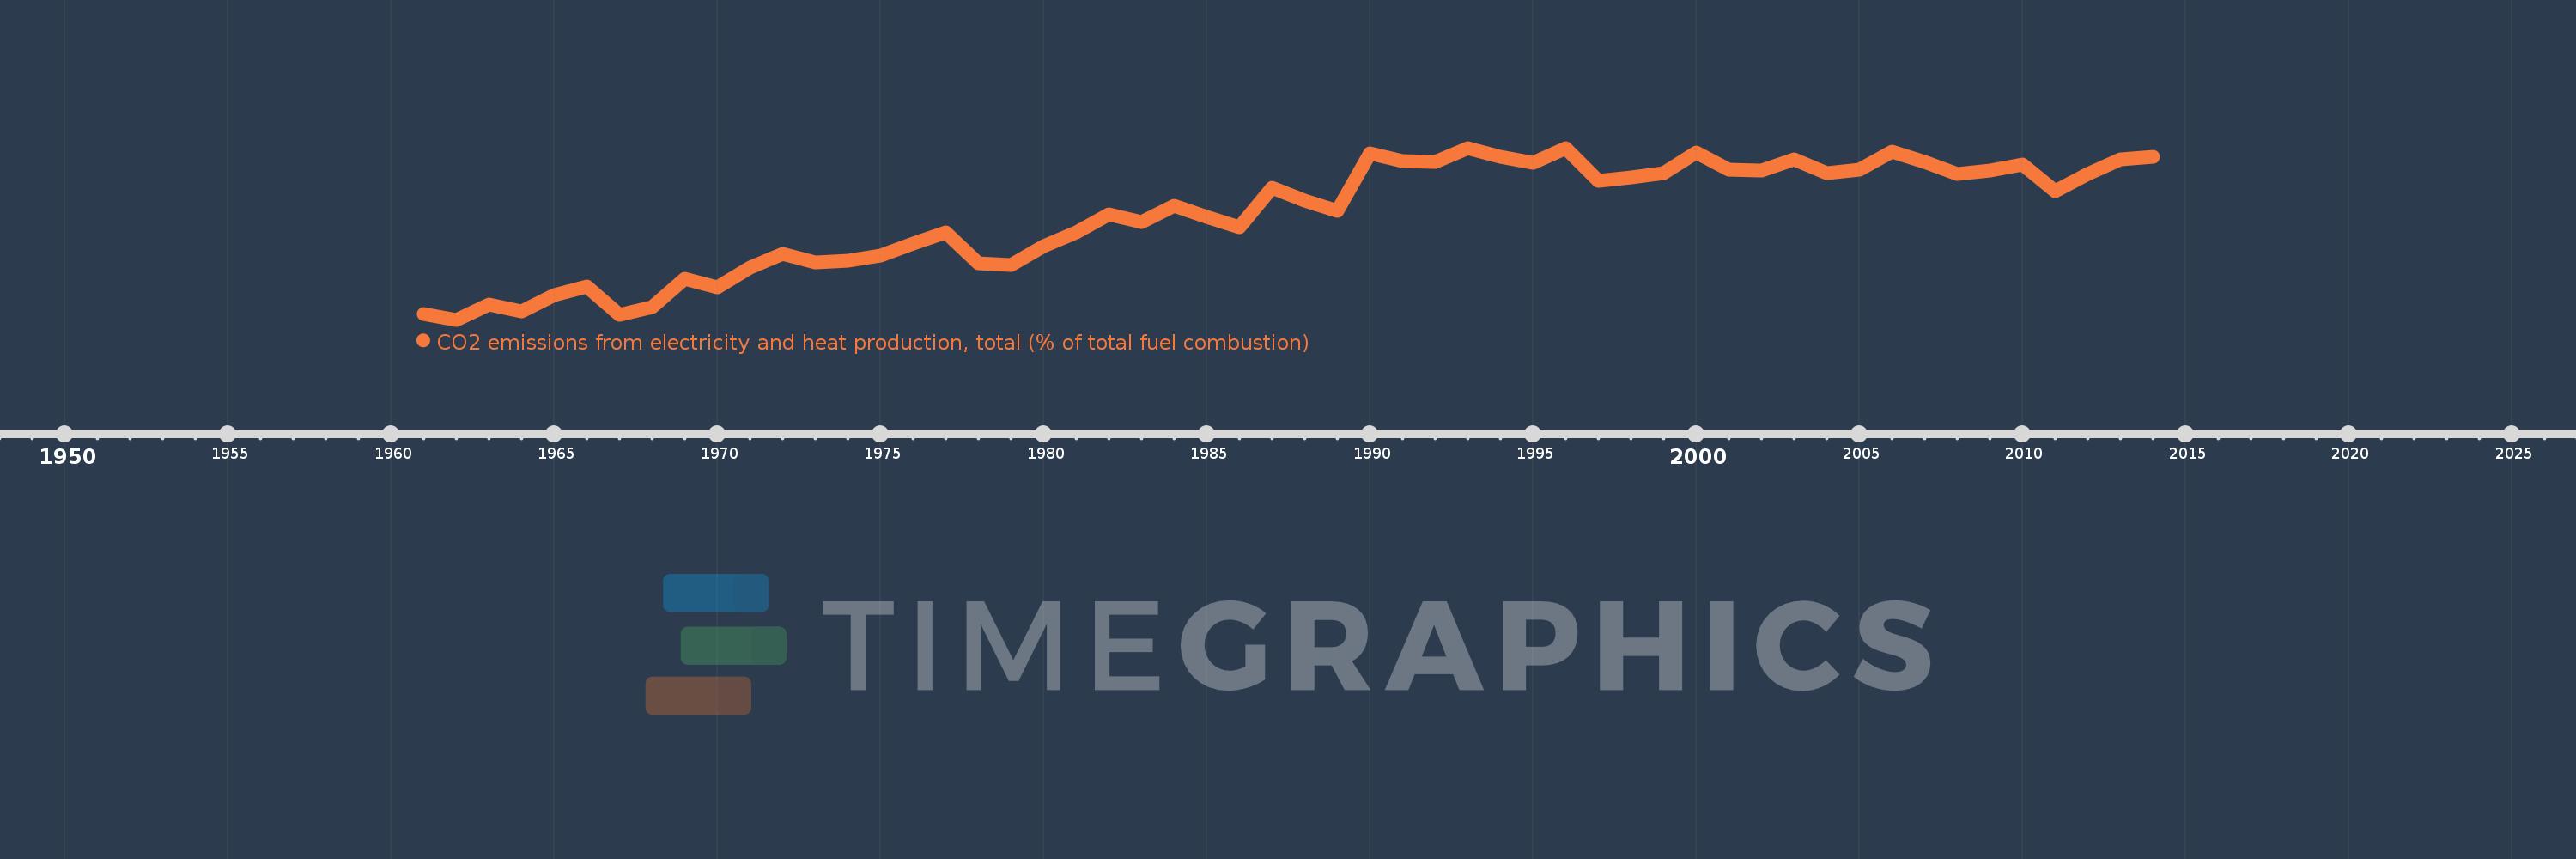
CO2 emissions from electricity and heat production, total (% of total fuel combustion)
2014,2013,2012,2011,2010,2009,2008,2007,2006,2005,2004,2003,2002,2001,2000,1999,1998,1997,1996,1995,1994,1993,1992,1991,1990,1989,1988,1987,1986,1985,1984,1983,1982,1981,1980,1979,1978,1977,1976,1975,1974,1973,1972,1971,1970,1969,1968,1967,1966,1965,1964,1963,1962,1961
This statistics in other country:
AlbaniaAlgeriaAngolaArab WorldArgentinaArmeniaAustraliaAustriaAzerbaijanBahrainBangladeshBelarusBelgiumBeninBoliviaBosnia and HerzegovinaBotswanaBrazilBrunei DarussalamBulgariaCambodiaCameroonCanadaCaribbean small statesCentral Europe and the BalticsChileChinaColombiaCongo, Dem. Rep.Congo, Rep.Costa RicaCote d'IvoireCroatiaCubaCuracaoCyprusCzech RepublicDenmarkDominican RepublicEarly-demographic dividendEast Asia & PacificEast Asia & Pacific (excluding high income)East Asia & Pacific (IDA & IBRD countries)EcuadorEgypt, Arab Rep.El SalvadorEritreaEstoniaEthiopiaEuro areaEurope & Central AsiaEurope & Central Asia (excluding high income)Europe & Central Asia (IDA & IBRD countries)European UnionFinlandFragile and conflict affected situationsFranceGabonGeorgiaGermanyGhanaGibraltarGreeceGuatemalaHaitiHeavily indebted poor countries (HIPC)High incomeHondurasHong Kong SAR, ChinaHungaryIBRD onlyIcelandIDA & IBRD totalIDA blendIDA onlyIDA totalIndiaIndonesiaIran, Islamic Rep.IraqIrelandIsraelItalyJamaicaJapanJordanKazakhstanKenyaKorea, Dem. People’s Rep.Korea, Rep.KosovoKuwaitKyrgyz RepublicLate-demographic dividendLatin America & Caribbean Latin America & Caribbean (excluding high income)Latin America & the Caribbean (IDA & IBRD countries)LatviaLeast developed countries: UN classificationLebanonLibyaLithuaniaLow & middle incomeLow incomeLower middle incomeLuxembourgMacedonia, FYRMalaysiaMaltaMauritiusMexicoMiddle East & North AfricaMiddle East & North Africa (excluding high income)Middle East & North Africa (IDA & IBRD countries)Middle incomeMoldovaMongoliaMontenegroMoroccoMozambiqueMyanmarNamibiaNepalNetherlandsNew ZealandNicaraguaNigerNigeriaNorth AmericaNorwayOECD membersOmanOther small statesPakistanPanamaParaguayPeruPhilippinesPolandPortugalPost-demographic dividendPre-demographic dividendQatarRomaniaRussian FederationSaudi ArabiaSenegalSerbiaSingaporeSlovak RepublicSloveniaSmall statesSouth AfricaSouth AsiaSouth Asia (IDA & IBRD)South SudanSpainSri LankaSub-Saharan Africa Sub-Saharan Africa (excluding high income)Sub-Saharan Africa (IDA & IBRD countries)SudanSwedenSwitzerlandSyrian Arab RepublicTajikistanTanzaniaThailandTogoTrinidad and TobagoTunisiaTurkeyTurkmenistanUkraineUnited Arab EmiratesUnited KingdomUnited StatesUpper middle incomeUruguayUzbekistanVenezuela, RBVietnamWorldYemen, Rep.ZambiaZimbabwe Timeline:
This timeline shows a graph from 1961 to 2014 of Portugal. No data until 1960. Number of actual observations by date: 54.
Source name:
World Development Indicators
Source organization:
IEA Statistics © OECD/IEA 2014 (http://www.iea.org/stats/index.asp), subject to https://www.iea.org/t&c/termsandconditions/
Categories, topics:
Environment
Last updated:
apr 23, 2017
Indicators value changes by year
Maximum:
46.482
jan 1, 1993
At the date of observation
Value
Absolute change
Change from previous value
jan 1, 1961
9.046
+9.046
0.0%
jan 1, 1962
7.747
-1.299
-14.36%
jan 1, 1963
11.111
+3.364
43.42%
jan 1, 1964
9.64
-1.471
-13.24%
jan 1, 1965
13.244
+3.604
37.39%
jan 1, 1966
15.235
+1.991
15.03%
jan 1, 1967
8.762
-6.473
-42.49%
jan 1, 1968
10.668
+1.906
21.76%
jan 1, 1969
17.026
+6.358
59.59%
jan 1, 1970
14.995
-2.031
-11.93%
jan 1, 1971
19.453
+4.458
29.73%
jan 1, 1972
22.516
+3.063
15.74%
jan 1, 1973
20.702
-1.814
-8.06%
jan 1, 1974
21.124
+0.423
2.04%
jan 1, 1975
22.148
+1.024
4.85%
jan 1, 1976
24.861
+2.713
12.25%
jan 1, 1977
27.456
+2.595
10.44%
jan 1, 1978
20.533
-6.923
-25.21%
jan 1, 1979
20.152
-0.381
-1.86%
jan 1, 1980
24.406
+4.254
21.11%
jan 1, 1981
27.422
+3.016
12.36%
jan 1, 1982
31.524
+4.102
14.96%
jan 1, 1983
29.771
-1.753
-5.56%
jan 1, 1984
33.41
+3.639
12.22%
jan 1, 1985
31.003
-2.407
-7.21%
jan 1, 1986
28.595
-2.407
-7.77%
jan 1, 1987
37.445
+8.85
30.95%
jan 1, 1988
34.631
-2.814
-7.52%
jan 1, 1989
32.236
-2.395
-6.92%
jan 1, 1990
45.246
+13.011
40.36%
jan 1, 1991
43.532
-1.714
-3.79%
jan 1, 1992
43.251
-0.281
-0.64%
jan 1, 1993
46.482
+3.23
7.47%
jan 1, 1994
44.541
-1.941
-4.18%
jan 1, 1995
43.114
-1.427
-3.2%
jan 1, 1996
46.357
+3.244
7.52%
jan 1, 1997
39.016
-7.341
-15.84%
jan 1, 1998
39.802
+0.785
2.01%
jan 1, 1999
40.711
+0.909
2.28%
jan 1, 2000
45.451
+4.741
11.64%
jan 1, 2001
41.58
-3.871
-8.52%
jan 1, 2002
41.323
-0.257
-0.62%
jan 1, 2003
43.904
+2.581
6.25%
jan 1, 2004
40.721
-3.183
-7.25%
jan 1, 2005
41.662
+0.942
2.31%
jan 1, 2006
45.576
+3.914
9.39%
jan 1, 2007
43.363
-2.213
-4.85%
jan 1, 2008
40.59
-2.774
-6.4%
jan 1, 2009
41.329
+0.74
1.82%
jan 1, 2010
42.838
+1.509
3.65%
jan 1, 2011
36.719
-6.119
-14.28%
jan 1, 2012
40.689
+3.97
10.81%
jan 1, 2013
43.974
+3.285
8.07%
jan 1, 2014
44.479
+0.505
1.15%
Ranking of countries by current statistics by years


Comments: