29
/
en
AIzaSyAYiBZKx7MnpbEhh9jyipgxe19OcubqV5w
April 1, 2024
207741
Netherlands
NLD
true
2
1
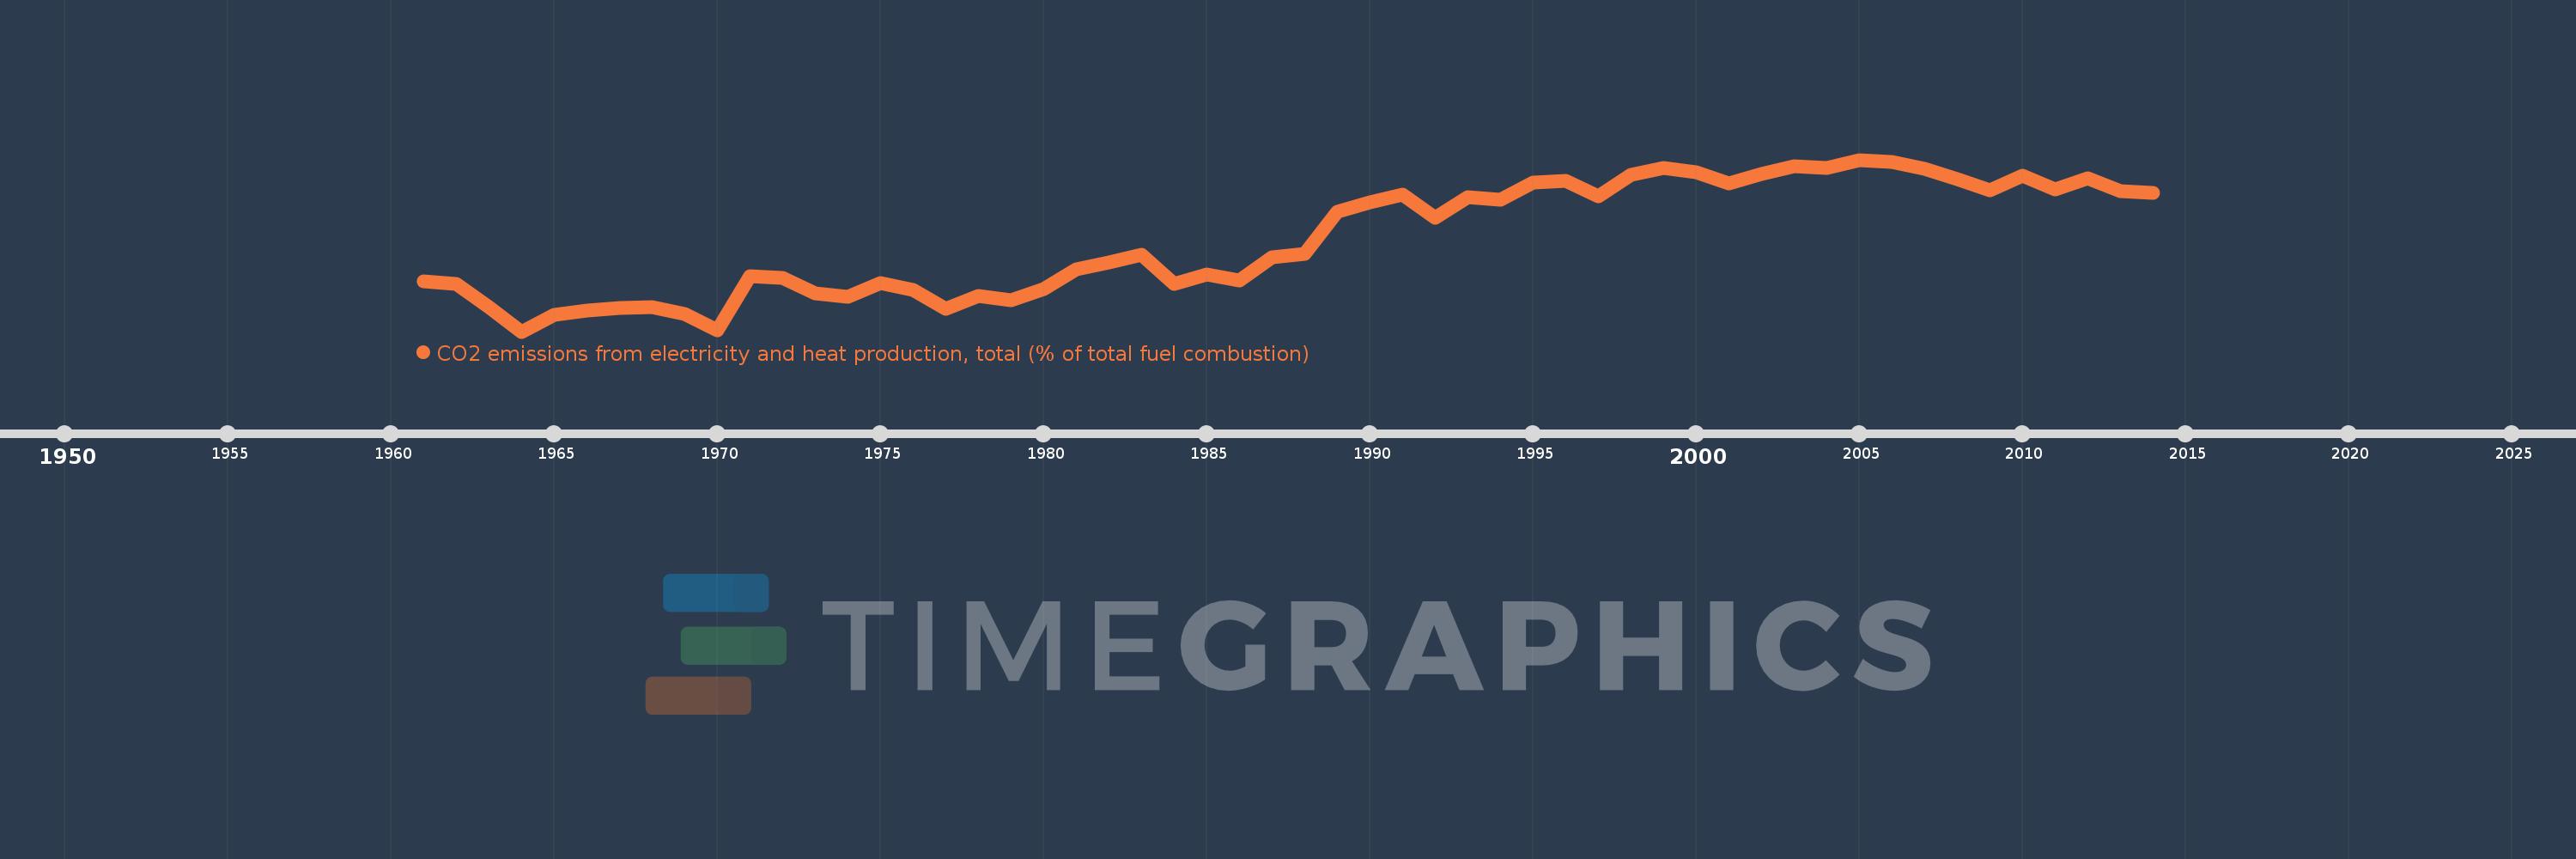
CO2 emissions from electricity and heat production, total (% of total fuel combustion)
2014,2013,2012,2011,2010,2009,2008,2007,2006,2005,2004,2003,2002,2001,2000,1999,1998,1997,1996,1995,1994,1993,1992,1991,1990,1989,1988,1987,1986,1985,1984,1983,1982,1981,1980,1979,1978,1977,1976,1975,1974,1973,1972,1971,1970,1969,1968,1967,1966,1965,1964,1963,1962,1961
This statistics in other country:
AlbaniaAlgeriaAngolaArab WorldArgentinaArmeniaAustraliaAustriaAzerbaijanBahrainBangladeshBelarusBelgiumBeninBoliviaBosnia and HerzegovinaBotswanaBrazilBrunei DarussalamBulgariaCambodiaCameroonCanadaCaribbean small statesCentral Europe and the BalticsChileChinaColombiaCongo, Dem. Rep.Congo, Rep.Costa RicaCote d'IvoireCroatiaCubaCuracaoCyprusCzech RepublicDenmarkDominican RepublicEarly-demographic dividendEast Asia & PacificEast Asia & Pacific (excluding high income)East Asia & Pacific (IDA & IBRD countries)EcuadorEgypt, Arab Rep.El SalvadorEritreaEstoniaEthiopiaEuro areaEurope & Central AsiaEurope & Central Asia (excluding high income)Europe & Central Asia (IDA & IBRD countries)European UnionFinlandFragile and conflict affected situationsFranceGabonGeorgiaGermanyGhanaGibraltarGreeceGuatemalaHaitiHeavily indebted poor countries (HIPC)High incomeHondurasHong Kong SAR, ChinaHungaryIBRD onlyIcelandIDA & IBRD totalIDA blendIDA onlyIDA totalIndiaIndonesiaIran, Islamic Rep.IraqIrelandIsraelItalyJamaicaJapanJordanKazakhstanKenyaKorea, Dem. People’s Rep.Korea, Rep.KosovoKuwaitKyrgyz RepublicLate-demographic dividendLatin America & Caribbean Latin America & Caribbean (excluding high income)Latin America & the Caribbean (IDA & IBRD countries)LatviaLeast developed countries: UN classificationLebanonLibyaLithuaniaLow & middle incomeLow incomeLower middle incomeLuxembourgMacedonia, FYRMalaysiaMaltaMauritiusMexicoMiddle East & North AfricaMiddle East & North Africa (excluding high income)Middle East & North Africa (IDA & IBRD countries)Middle incomeMoldovaMongoliaMontenegroMoroccoMozambiqueMyanmarNamibiaNepalNetherlandsNew ZealandNicaraguaNigerNigeriaNorth AmericaNorwayOECD membersOmanOther small statesPakistanPanamaParaguayPeruPhilippinesPolandPortugalPost-demographic dividendPre-demographic dividendQatarRomaniaRussian FederationSaudi ArabiaSenegalSerbiaSingaporeSlovak RepublicSloveniaSmall statesSouth AfricaSouth AsiaSouth Asia (IDA & IBRD)South SudanSpainSri LankaSub-Saharan Africa Sub-Saharan Africa (excluding high income)Sub-Saharan Africa (IDA & IBRD countries)SudanSwedenSwitzerlandSyrian Arab RepublicTajikistanTanzaniaThailandTogoTrinidad and TobagoTunisiaTurkeyTurkmenistanUkraineUnited Arab EmiratesUnited KingdomUnited StatesUpper middle incomeUruguayUzbekistanVenezuela, RBVietnamWorldYemen, Rep.ZambiaZimbabwe Timeline:
This timeline shows a graph from 1961 to 2014 of Netherlands. No data until 1960. Number of actual observations by date: 54.
Source name:
World Development Indicators
Source organization:
IEA Statistics © OECD/IEA 2014 (http://www.iea.org/stats/index.asp), subject to https://www.iea.org/t&c/termsandconditions/
Categories, topics:
Environment
Last updated:
apr 23, 2017
Indicators value changes by year
Minimum:
28.486
jan 1, 1964
Maximum:
44.008
jan 1, 2005
At the date of observation
Value
Absolute change
Change from previous value
jan 1, 1961
33.0
+33.0
0.0%
jan 1, 1962
32.797
-0.202
-0.61%
jan 1, 1963
30.661
-2.136
-6.51%
jan 1, 1964
28.486
-2.175
-7.09%
jan 1, 1965
30.017
+1.531
5.37%
jan 1, 1966
30.383
+0.366
1.22%
jan 1, 1967
30.584
+0.2
0.66%
jan 1, 1968
30.683
+0.099
0.32%
jan 1, 1969
30.055
-0.628
-2.05%
jan 1, 1970
28.633
-1.422
-4.73%
jan 1, 1971
33.5
+4.867
17.0%
jan 1, 1972
33.346
-0.153
-0.46%
jan 1, 1973
31.908
-1.438
-4.31%
jan 1, 1974
31.613
-0.296
-0.93%
jan 1, 1975
32.857
+1.245
3.94%
jan 1, 1976
32.287
-0.57
-1.74%
jan 1, 1977
30.547
-1.74
-5.39%
jan 1, 1978
31.725
+1.179
3.86%
jan 1, 1979
31.323
-0.402
-1.27%
jan 1, 1980
32.364
+1.041
3.32%
jan 1, 1981
34.122
+1.758
5.43%
jan 1, 1982
34.744
+0.622
1.82%
jan 1, 1983
35.412
+0.668
1.92%
jan 1, 1984
32.83
-2.582
-7.29%
jan 1, 1985
33.683
+0.853
2.6%
jan 1, 1986
33.068
-0.615
-1.83%
jan 1, 1987
35.238
+2.17
6.56%
jan 1, 1988
35.522
+0.284
0.8%
jan 1, 1989
39.277
+3.755
10.57%
jan 1, 1990
40.161
+0.884
2.25%
jan 1, 1991
40.877
+0.716
1.78%
jan 1, 1992
38.806
-2.07
-5.06%
jan 1, 1993
40.631
+1.824
4.7%
jan 1, 1994
40.391
-0.24
-0.59%
jan 1, 1995
41.943
+1.552
3.84%
jan 1, 1996
42.081
+0.138
0.33%
jan 1, 1997
40.745
-1.337
-3.18%
jan 1, 1998
42.615
+1.871
4.59%
jan 1, 1999
43.25
+0.635
1.49%
jan 1, 2000
42.915
-0.335
-0.77%
jan 1, 2001
41.879
-1.036
-2.41%
jan 1, 2002
42.709
+0.83
1.98%
jan 1, 2003
43.442
+0.733
1.72%
jan 1, 2004
43.297
-0.145
-0.33%
jan 1, 2005
44.008
+0.711
1.64%
jan 1, 2006
43.804
-0.204
-0.46%
jan 1, 2007
43.163
-0.641
-1.46%
jan 1, 2008
42.256
-0.907
-2.1%
jan 1, 2009
41.229
-1.027
-2.43%
jan 1, 2010
42.571
+1.342
3.26%
jan 1, 2011
41.306
-1.265
-2.97%
jan 1, 2012
42.325
+1.019
2.47%
jan 1, 2013
41.176
-1.149
-2.71%
jan 1, 2014
41.055
-0.121
-0.29%
Ranking of countries by current statistics by years


Comments: