29
/
en
AIzaSyAYiBZKx7MnpbEhh9jyipgxe19OcubqV5w
April 1, 2024
86948
Bolivia
BOL
true
2
1
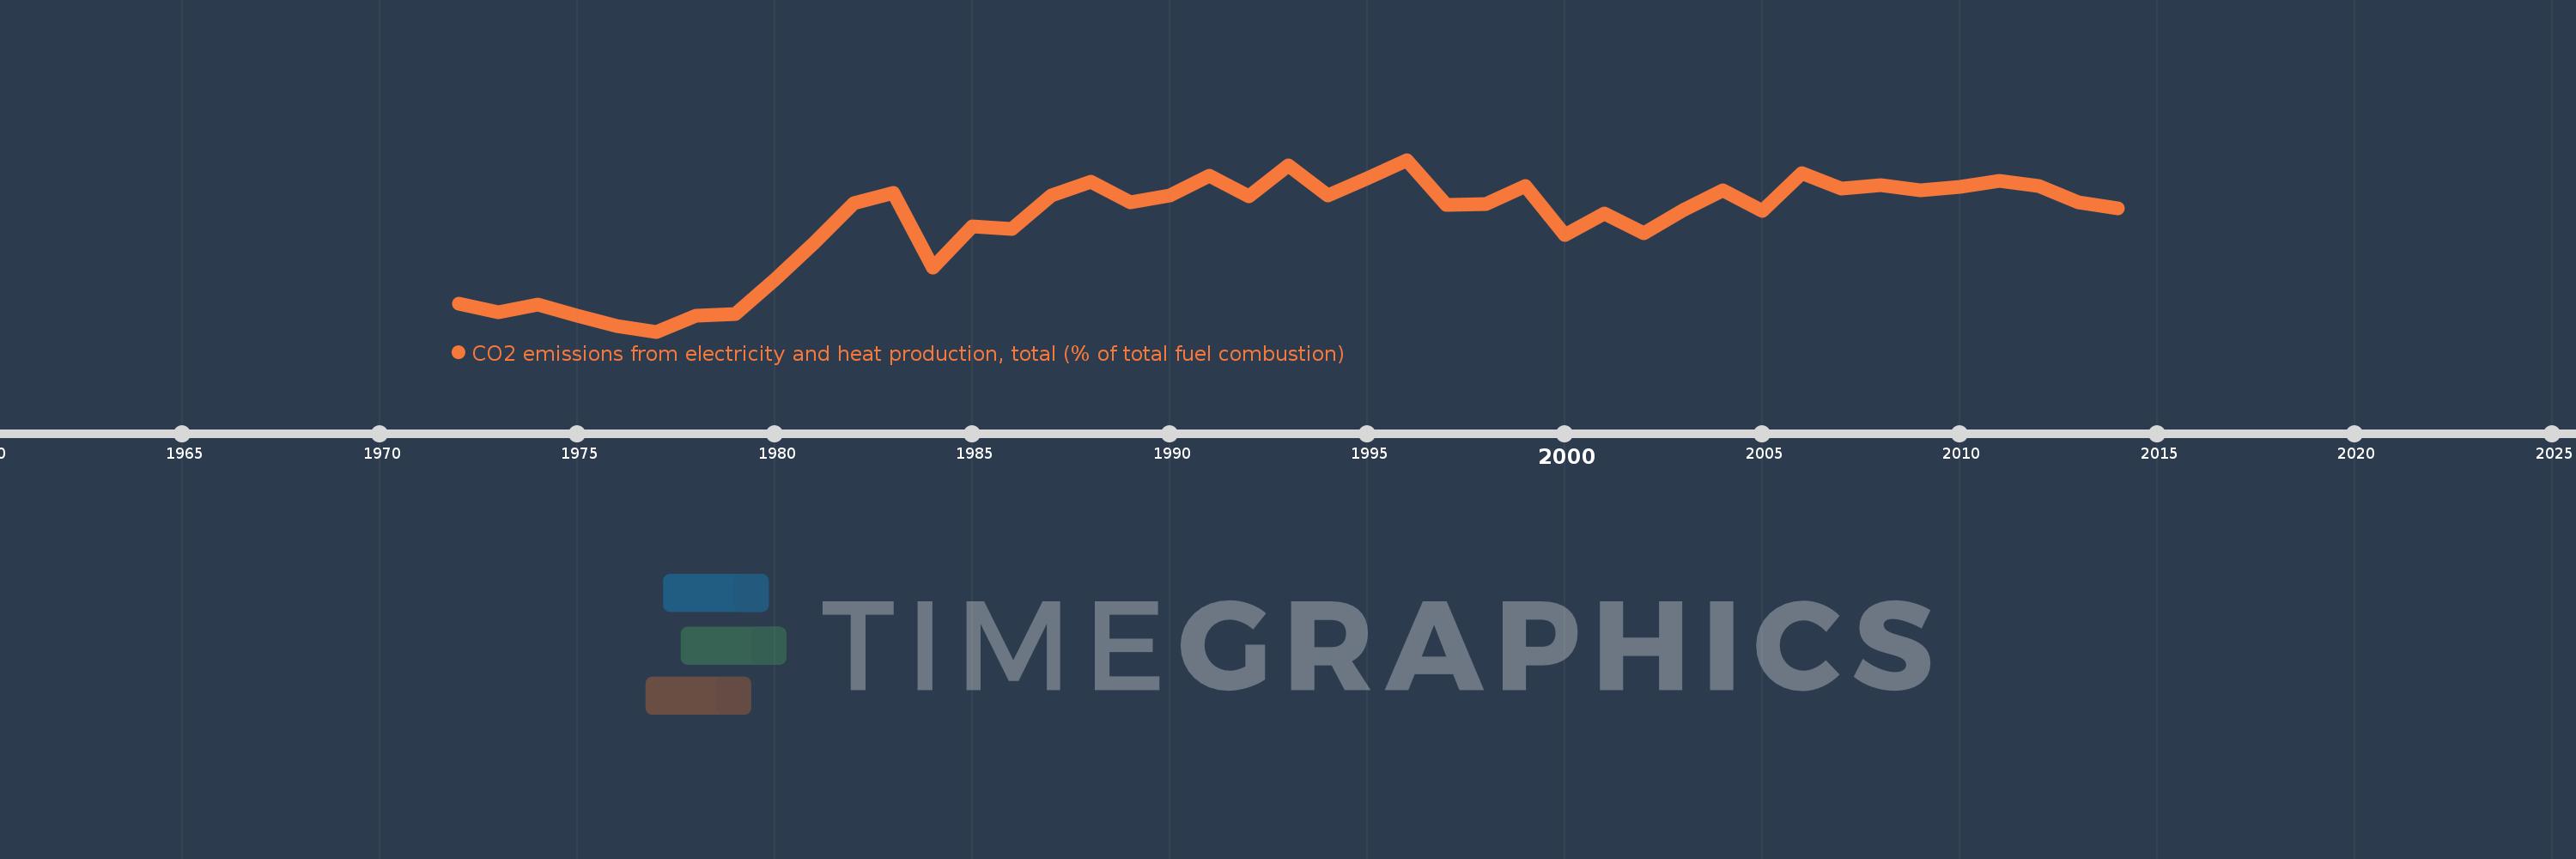
CO2 emissions from electricity and heat production, total (% of total fuel combustion)
2014,2013,2012,2011,2010,2009,2008,2007,2006,2005,2004,2003,2002,2001,2000,1999,1998,1997,1996,1995,1994,1993,1992,1991,1990,1989,1988,1987,1986,1985,1984,1983,1982,1981,1980,1979,1978,1977,1976,1975,1974,1973,1972
This statistics in other country:
AlbaniaAlgeriaAngolaArab WorldArgentinaArmeniaAustraliaAustriaAzerbaijanBahrainBangladeshBelarusBelgiumBeninBoliviaBosnia and HerzegovinaBotswanaBrazilBrunei DarussalamBulgariaCambodiaCameroonCanadaCaribbean small statesCentral Europe and the BalticsChileChinaColombiaCongo, Dem. Rep.Congo, Rep.Costa RicaCote d'IvoireCroatiaCubaCuracaoCyprusCzech RepublicDenmarkDominican RepublicEarly-demographic dividendEast Asia & PacificEast Asia & Pacific (excluding high income)East Asia & Pacific (IDA & IBRD countries)EcuadorEgypt, Arab Rep.El SalvadorEritreaEstoniaEthiopiaEuro areaEurope & Central AsiaEurope & Central Asia (excluding high income)Europe & Central Asia (IDA & IBRD countries)European UnionFinlandFragile and conflict affected situationsFranceGabonGeorgiaGermanyGhanaGibraltarGreeceGuatemalaHaitiHeavily indebted poor countries (HIPC)High incomeHondurasHong Kong SAR, ChinaHungaryIBRD onlyIcelandIDA & IBRD totalIDA blendIDA onlyIDA totalIndiaIndonesiaIran, Islamic Rep.IraqIrelandIsraelItalyJamaicaJapanJordanKazakhstanKenyaKorea, Dem. People’s Rep.Korea, Rep.KosovoKuwaitKyrgyz RepublicLate-demographic dividendLatin America & Caribbean Latin America & Caribbean (excluding high income)Latin America & the Caribbean (IDA & IBRD countries)LatviaLeast developed countries: UN classificationLebanonLibyaLithuaniaLow & middle incomeLow incomeLower middle incomeLuxembourgMacedonia, FYRMalaysiaMaltaMauritiusMexicoMiddle East & North AfricaMiddle East & North Africa (excluding high income)Middle East & North Africa (IDA & IBRD countries)Middle incomeMoldovaMongoliaMontenegroMoroccoMozambiqueMyanmarNamibiaNepalNetherlandsNew ZealandNicaraguaNigerNigeriaNorth AmericaNorwayOECD membersOmanOther small statesPakistanPanamaParaguayPeruPhilippinesPolandPortugalPost-demographic dividendPre-demographic dividendQatarRomaniaRussian FederationSaudi ArabiaSenegalSerbiaSingaporeSlovak RepublicSloveniaSmall statesSouth AfricaSouth AsiaSouth Asia (IDA & IBRD)South SudanSpainSri LankaSub-Saharan Africa Sub-Saharan Africa (excluding high income)Sub-Saharan Africa (IDA & IBRD countries)SudanSwedenSwitzerlandSyrian Arab RepublicTajikistanTanzaniaThailandTogoTrinidad and TobagoTunisiaTurkeyTurkmenistanUkraineUnited Arab EmiratesUnited KingdomUnited StatesUpper middle incomeUruguayUzbekistanVenezuela, RBVietnamWorldYemen, Rep.ZambiaZimbabwe Timeline:
This timeline shows a graph from 1972 to 2014 of Bolivia. No data until 1971. Number of actual observations by date: 43.
Source name:
World Development Indicators
Source organization:
IEA Statistics © OECD/IEA 2014 (http://www.iea.org/stats/index.asp), subject to https://www.iea.org/t&c/termsandconditions/
Categories, topics:
Environment
Last updated:
apr 23, 2017
Indicators value changes by year
Minimum:
15.297
jan 1, 1977
Maximum:
31.205
jan 1, 1996
At the date of observation
Value
Absolute change
Change from previous value
jan 1, 1972
17.89
+17.89
0.0%
jan 1, 1973
17.083
-0.807
-4.51%
jan 1, 1974
17.787
+0.703
4.12%
jan 1, 1975
16.788
-0.998
-5.61%
jan 1, 1976
15.839
-0.95
-5.66%
jan 1, 1977
15.297
-0.541
-3.42%
jan 1, 1978
16.8
+1.503
9.82%
jan 1, 1979
16.953
+0.153
0.91%
jan 1, 1980
20.098
+3.145
18.55%
jan 1, 1981
23.515
+3.417
17.0%
jan 1, 1982
27.152
+3.637
15.47%
jan 1, 1983
28.131
+0.979
3.61%
jan 1, 1984
21.255
-6.876
-24.44%
jan 1, 1985
25.054
+3.799
17.88%
jan 1, 1986
24.826
-0.228
-0.91%
jan 1, 1987
27.885
+3.059
12.32%
jan 1, 1988
29.195
+1.311
4.7%
jan 1, 1989
27.23
-1.965
-6.73%
jan 1, 1990
27.907
+0.677
2.49%
jan 1, 1991
29.709
+1.802
6.46%
jan 1, 1992
27.853
-1.856
-6.25%
jan 1, 1993
30.684
+2.831
10.16%
jan 1, 1994
27.886
-2.798
-9.12%
jan 1, 1995
29.508
+1.622
5.82%
jan 1, 1996
31.205
+1.696
5.75%
jan 1, 1997
27.048
-4.157
-13.32%
jan 1, 1998
27.077
+0.029
0.11%
jan 1, 1999
28.818
+1.742
6.43%
jan 1, 2000
24.275
-4.544
-15.77%
jan 1, 2001
26.227
+1.952
8.04%
jan 1, 2002
24.415
-1.812
-6.91%
jan 1, 2003
26.539
+2.124
8.7%
jan 1, 2004
28.356
+1.817
6.85%
jan 1, 2005
26.491
-1.866
-6.58%
jan 1, 2006
29.947
+3.456
13.05%
jan 1, 2007
28.558
-1.39
-4.64%
jan 1, 2008
28.839
+0.282
0.99%
jan 1, 2009
28.348
-0.491
-1.7%
jan 1, 2010
28.739
+0.391
1.38%
jan 1, 2011
29.241
+0.501
1.74%
jan 1, 2012
28.796
-0.445
-1.52%
jan 1, 2013
27.267
-1.528
-5.31%
jan 1, 2014
26.69
-0.578
-2.12%
Ranking of countries by current statistics by years


Comments: