29
/
en
AIzaSyAYiBZKx7MnpbEhh9jyipgxe19OcubqV5w
April 1, 2024
214111
Norway
NOR
true
2
1
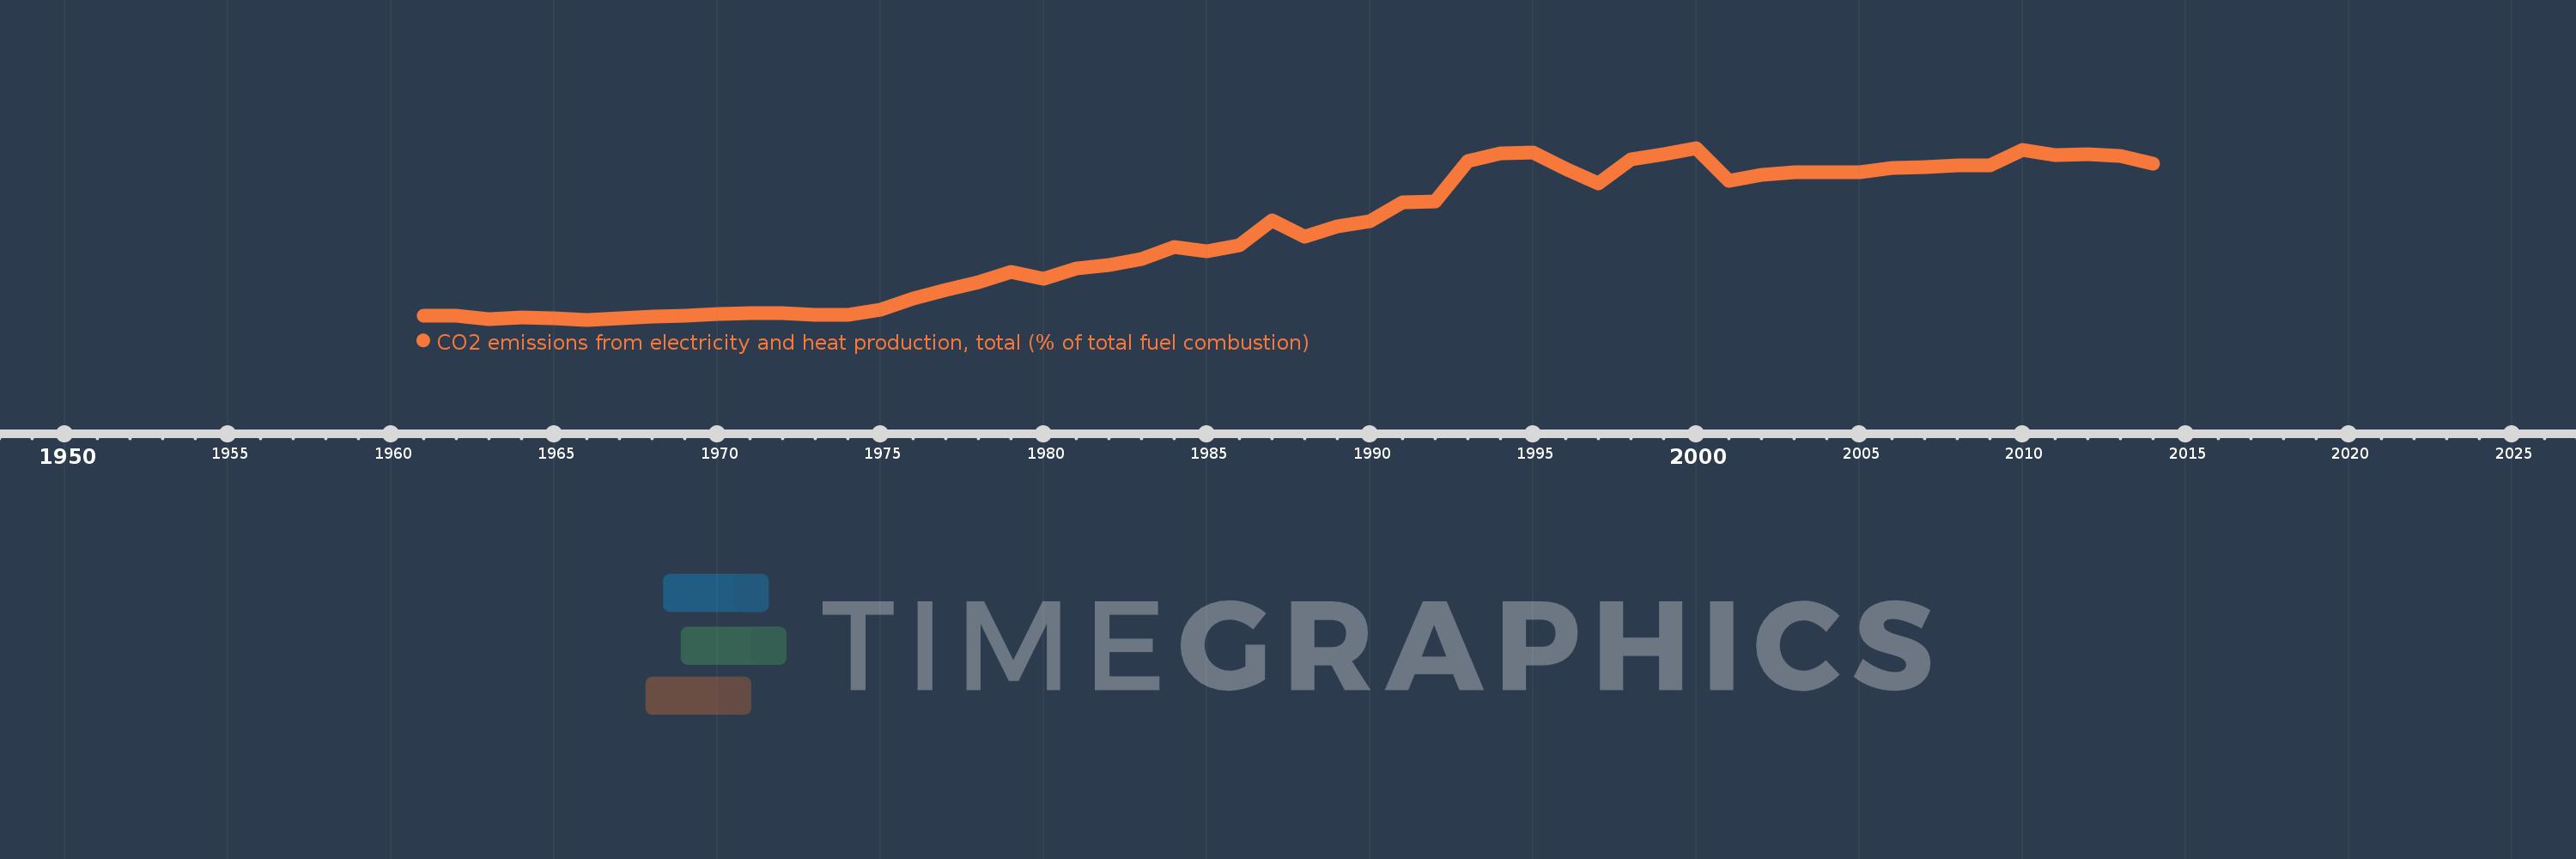
CO2 emissions from electricity and heat production, total (% of total fuel combustion)
2014,2013,2012,2011,2010,2009,2008,2007,2006,2005,2004,2003,2002,2001,2000,1999,1998,1997,1996,1995,1994,1993,1992,1991,1990,1989,1988,1987,1986,1985,1984,1983,1982,1981,1980,1979,1978,1977,1976,1975,1974,1973,1972,1971,1970,1969,1968,1967,1966,1965,1964,1963,1962,1961
This statistics in other country:
AlbaniaAlgeriaAngolaArab WorldArgentinaArmeniaAustraliaAustriaAzerbaijanBahrainBangladeshBelarusBelgiumBeninBoliviaBosnia and HerzegovinaBotswanaBrazilBrunei DarussalamBulgariaCambodiaCameroonCanadaCaribbean small statesCentral Europe and the BalticsChileChinaColombiaCongo, Dem. Rep.Congo, Rep.Costa RicaCote d'IvoireCroatiaCubaCuracaoCyprusCzech RepublicDenmarkDominican RepublicEarly-demographic dividendEast Asia & PacificEast Asia & Pacific (excluding high income)East Asia & Pacific (IDA & IBRD countries)EcuadorEgypt, Arab Rep.El SalvadorEritreaEstoniaEthiopiaEuro areaEurope & Central AsiaEurope & Central Asia (excluding high income)Europe & Central Asia (IDA & IBRD countries)European UnionFinlandFragile and conflict affected situationsFranceGabonGeorgiaGermanyGhanaGibraltarGreeceGuatemalaHaitiHeavily indebted poor countries (HIPC)High incomeHondurasHong Kong SAR, ChinaHungaryIBRD onlyIcelandIDA & IBRD totalIDA blendIDA onlyIDA totalIndiaIndonesiaIran, Islamic Rep.IraqIrelandIsraelItalyJamaicaJapanJordanKazakhstanKenyaKorea, Dem. People’s Rep.Korea, Rep.KosovoKuwaitKyrgyz RepublicLate-demographic dividendLatin America & Caribbean Latin America & Caribbean (excluding high income)Latin America & the Caribbean (IDA & IBRD countries)LatviaLeast developed countries: UN classificationLebanonLibyaLithuaniaLow & middle incomeLow incomeLower middle incomeLuxembourgMacedonia, FYRMalaysiaMaltaMauritiusMexicoMiddle East & North AfricaMiddle East & North Africa (excluding high income)Middle East & North Africa (IDA & IBRD countries)Middle incomeMoldovaMongoliaMontenegroMoroccoMozambiqueMyanmarNamibiaNepalNetherlandsNew ZealandNicaraguaNigerNigeriaNorth AmericaNorwayOECD membersOmanOther small statesPakistanPanamaParaguayPeruPhilippinesPolandPortugalPost-demographic dividendPre-demographic dividendQatarRomaniaRussian FederationSaudi ArabiaSenegalSerbiaSingaporeSlovak RepublicSloveniaSmall statesSouth AfricaSouth AsiaSouth Asia (IDA & IBRD)South SudanSpainSri LankaSub-Saharan Africa Sub-Saharan Africa (excluding high income)Sub-Saharan Africa (IDA & IBRD countries)SudanSwedenSwitzerlandSyrian Arab RepublicTajikistanTanzaniaThailandTogoTrinidad and TobagoTunisiaTurkeyTurkmenistanUkraineUnited Arab EmiratesUnited KingdomUnited StatesUpper middle incomeUruguayUzbekistanVenezuela, RBVietnamWorldYemen, Rep.ZambiaZimbabwe Timeline:
This timeline shows a graph from 1961 to 2014 of Norway. No data until 1960. Number of actual observations by date: 54.
Source name:
World Development Indicators
Source organization:
IEA Statistics © OECD/IEA 2014 (http://www.iea.org/stats/index.asp), subject to https://www.iea.org/t&c/termsandconditions/
Categories, topics:
Environment
Last updated:
apr 23, 2017
Indicators value changes by year
Maximum:
38.503
jan 1, 2000
At the date of observation
Value
Absolute change
Change from previous value
jan 1, 1961
1.768
+1.768
0.0%
jan 1, 1962
1.732
-0.036
-2.01%
jan 1, 1963
1.079
-0.654
-37.74%
jan 1, 1964
1.4
+0.321
29.76%
jan 1, 1965
1.149
-0.251
-17.93%
jan 1, 1966
0.873
-0.276
-24.01%
jan 1, 1967
1.106
+0.233
26.74%
jan 1, 1968
1.63
+0.523
47.31%
jan 1, 1969
1.691
+0.062
3.8%
jan 1, 1970
2.068
+0.377
22.26%
jan 1, 1971
2.381
+0.313
15.13%
jan 1, 1972
2.305
-0.076
-3.18%
jan 1, 1973
1.911
-0.395
-17.11%
jan 1, 1974
1.884
-0.027
-1.43%
jan 1, 1975
3.041
+1.157
61.45%
jan 1, 1976
5.551
+2.51
82.53%
jan 1, 1977
7.419
+1.868
33.66%
jan 1, 1978
9.142
+1.723
23.23%
jan 1, 1979
11.263
+2.121
23.2%
jan 1, 1980
9.795
-1.468
-13.03%
jan 1, 1981
12.119
+2.324
23.73%
jan 1, 1982
12.844
+0.725
5.98%
jan 1, 1983
14.268
+1.424
11.09%
jan 1, 1984
16.803
+2.535
17.77%
jan 1, 1985
15.848
-0.955
-5.68%
jan 1, 1986
17.115
+1.266
7.99%
jan 1, 1987
22.652
+5.538
32.36%
jan 1, 1988
19.151
-3.501
-15.46%
jan 1, 1989
21.385
+2.234
11.66%
jan 1, 1990
22.481
+1.096
5.12%
jan 1, 1991
26.621
+4.14
18.42%
jan 1, 1992
26.859
+0.239
0.9%
jan 1, 1993
35.667
+8.808
32.79%
jan 1, 1994
37.287
+1.62
4.54%
jan 1, 1995
37.496
+0.209
0.56%
jan 1, 1996
33.959
-3.537
-9.43%
jan 1, 1997
30.791
-3.169
-9.33%
jan 1, 1998
35.957
+5.166
16.78%
jan 1, 1999
37.13
+1.173
3.26%
jan 1, 2000
38.503
+1.373
3.7%
jan 1, 2001
31.309
-7.194
-18.68%
jan 1, 2002
32.555
+1.246
3.98%
jan 1, 2003
33.108
+0.553
1.7%
jan 1, 2004
33.143
+0.035
0.11%
jan 1, 2005
33.146
+0.003
0.01%
jan 1, 2006
34.124
+0.978
2.95%
jan 1, 2007
34.337
+0.213
0.62%
jan 1, 2008
34.727
+0.39
1.14%
jan 1, 2009
34.775
+0.048
0.14%
jan 1, 2010
38.115
+3.34
9.6%
jan 1, 2011
37.01
-1.106
-2.9%
jan 1, 2012
37.073
+0.063
0.17%
jan 1, 2013
36.719
-0.354
-0.95%
jan 1, 2014
35.137
-1.582
-4.31%
Ranking of countries by current statistics by years


Comments: