29
/
en
AIzaSyAYiBZKx7MnpbEhh9jyipgxe19OcubqV5w
April 1, 2024
210112
Nicaragua
NIC
true
2
1
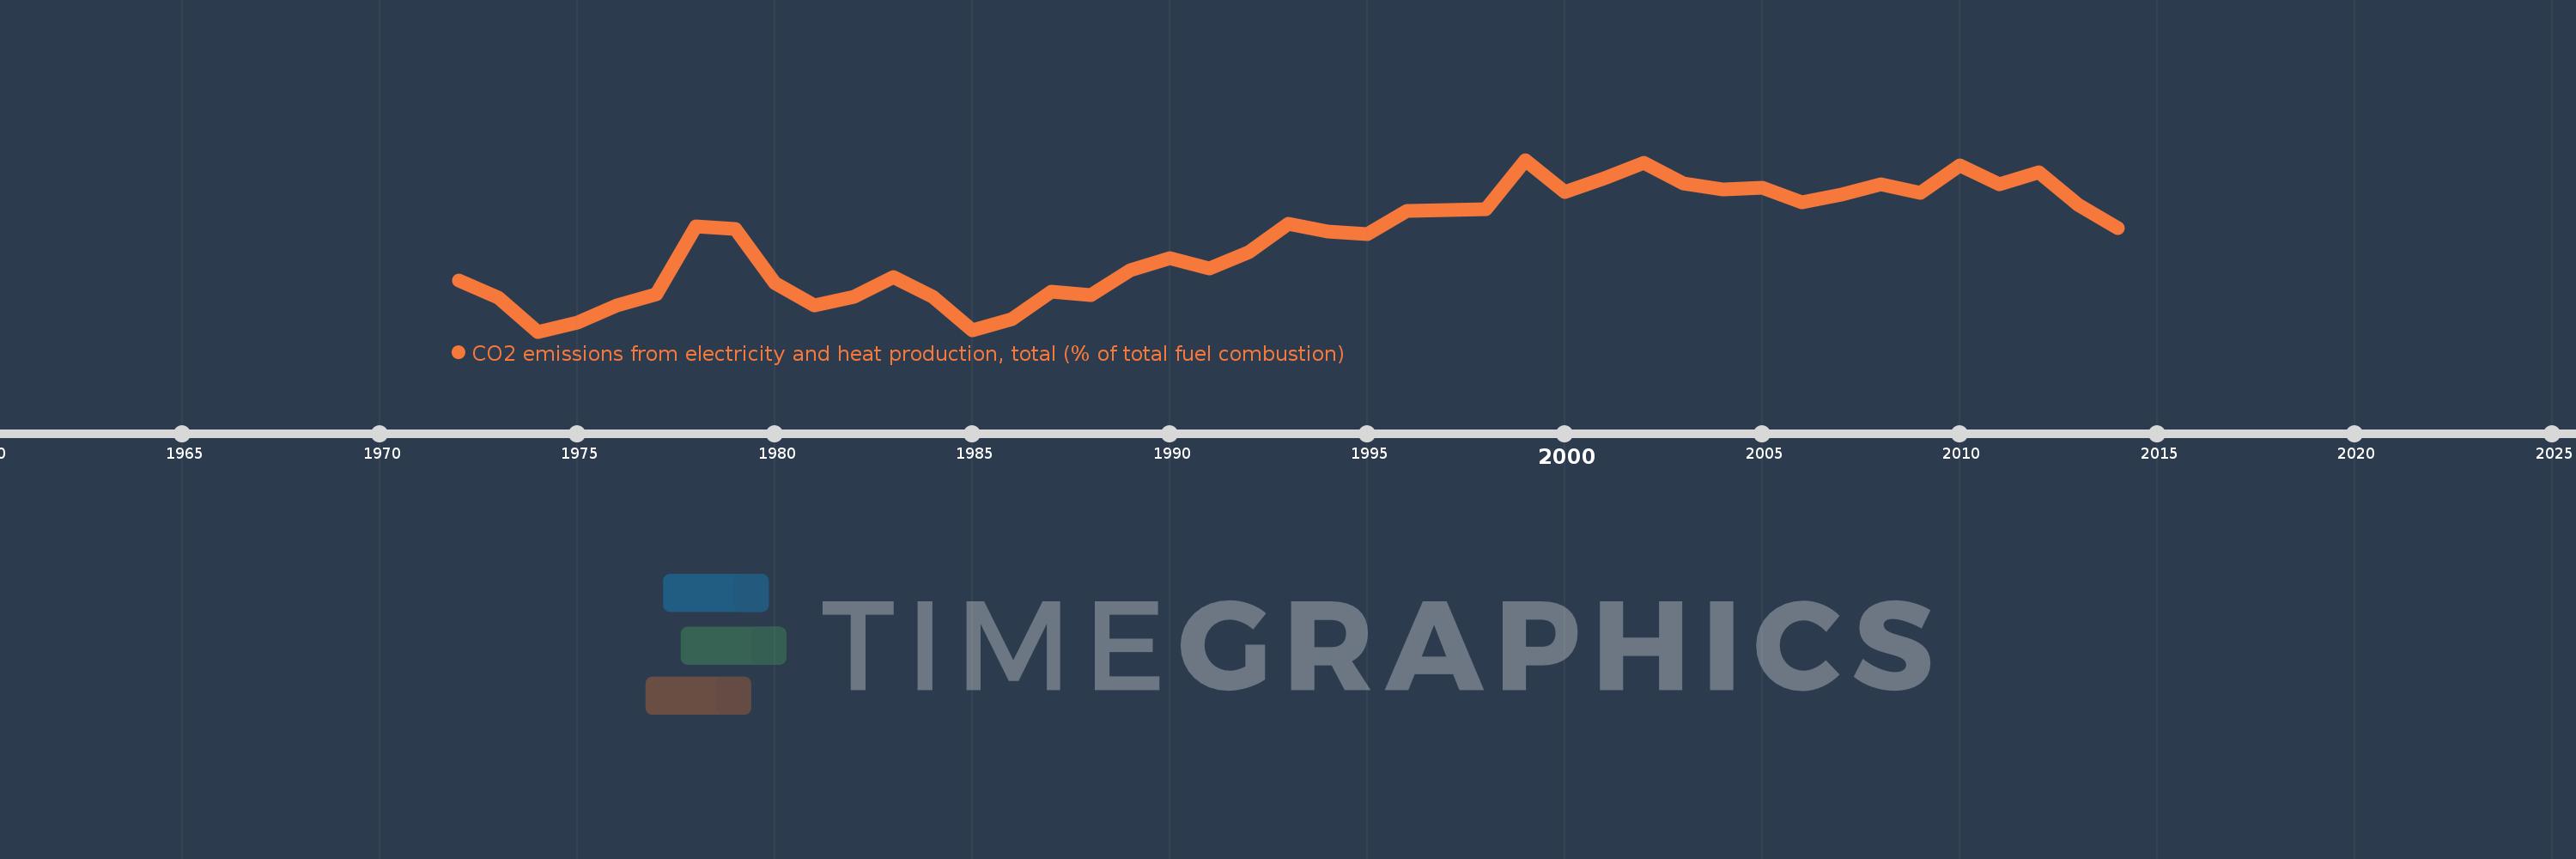
CO2 emissions from electricity and heat production, total (% of total fuel combustion)
2014,2013,2012,2011,2010,2009,2008,2007,2006,2005,2004,2003,2002,2001,2000,1999,1998,1997,1996,1995,1994,1993,1992,1991,1990,1989,1988,1987,1986,1985,1984,1983,1982,1981,1980,1979,1978,1977,1976,1975,1974,1973,1972
This statistics in other country:
AlbaniaAlgeriaAngolaArab WorldArgentinaArmeniaAustraliaAustriaAzerbaijanBahrainBangladeshBelarusBelgiumBeninBoliviaBosnia and HerzegovinaBotswanaBrazilBrunei DarussalamBulgariaCambodiaCameroonCanadaCaribbean small statesCentral Europe and the BalticsChileChinaColombiaCongo, Dem. Rep.Congo, Rep.Costa RicaCote d'IvoireCroatiaCubaCuracaoCyprusCzech RepublicDenmarkDominican RepublicEarly-demographic dividendEast Asia & PacificEast Asia & Pacific (excluding high income)East Asia & Pacific (IDA & IBRD countries)EcuadorEgypt, Arab Rep.El SalvadorEritreaEstoniaEthiopiaEuro areaEurope & Central AsiaEurope & Central Asia (excluding high income)Europe & Central Asia (IDA & IBRD countries)European UnionFinlandFragile and conflict affected situationsFranceGabonGeorgiaGermanyGhanaGibraltarGreeceGuatemalaHaitiHeavily indebted poor countries (HIPC)High incomeHondurasHong Kong SAR, ChinaHungaryIBRD onlyIcelandIDA & IBRD totalIDA blendIDA onlyIDA totalIndiaIndonesiaIran, Islamic Rep.IraqIrelandIsraelItalyJamaicaJapanJordanKazakhstanKenyaKorea, Dem. People’s Rep.Korea, Rep.KosovoKuwaitKyrgyz RepublicLate-demographic dividendLatin America & Caribbean Latin America & Caribbean (excluding high income)Latin America & the Caribbean (IDA & IBRD countries)LatviaLeast developed countries: UN classificationLebanonLibyaLithuaniaLow & middle incomeLow incomeLower middle incomeLuxembourgMacedonia, FYRMalaysiaMaltaMauritiusMexicoMiddle East & North AfricaMiddle East & North Africa (excluding high income)Middle East & North Africa (IDA & IBRD countries)Middle incomeMoldovaMongoliaMontenegroMoroccoMozambiqueMyanmarNamibiaNepalNetherlandsNew ZealandNicaraguaNigerNigeriaNorth AmericaNorwayOECD membersOmanOther small statesPakistanPanamaParaguayPeruPhilippinesPolandPortugalPost-demographic dividendPre-demographic dividendQatarRomaniaRussian FederationSaudi ArabiaSenegalSerbiaSingaporeSlovak RepublicSloveniaSmall statesSouth AfricaSouth AsiaSouth Asia (IDA & IBRD)South SudanSpainSri LankaSub-Saharan Africa Sub-Saharan Africa (excluding high income)Sub-Saharan Africa (IDA & IBRD countries)SudanSwedenSwitzerlandSyrian Arab RepublicTajikistanTanzaniaThailandTogoTrinidad and TobagoTunisiaTurkeyTurkmenistanUkraineUnited Arab EmiratesUnited KingdomUnited StatesUpper middle incomeUruguayUzbekistanVenezuela, RBVietnamWorldYemen, Rep.ZambiaZimbabwe Timeline:
This timeline shows a graph from 1972 to 2014 of Nicaragua. No data until 1971. Number of actual observations by date: 43.
Source name:
World Development Indicators
Source organization:
IEA Statistics © OECD/IEA 2014 (http://www.iea.org/stats/index.asp), subject to https://www.iea.org/t&c/termsandconditions/
Categories, topics:
Environment
Last updated:
apr 23, 2017
Indicators value changes by year
Minimum:
23.353
jan 1, 1974
Maximum:
44.048
jan 1, 1999
At the date of observation
Value
Absolute change
Change from previous value
jan 1, 1972
29.53
+29.53
0.0%
jan 1, 1973
27.451
-2.079
-7.04%
jan 1, 1974
23.353
-4.098
-14.93%
jan 1, 1975
24.457
+1.103
4.72%
jan 1, 1976
26.486
+2.03
8.3%
jan 1, 1977
27.83
+1.344
5.07%
jan 1, 1978
36.015
+8.185
29.41%
jan 1, 1979
35.745
-0.271
-0.75%
jan 1, 1980
29.221
-6.524
-18.25%
jan 1, 1981
26.519
-2.701
-9.24%
jan 1, 1982
27.513
+0.994
3.75%
jan 1, 1983
29.947
+2.433
8.84%
jan 1, 1984
27.551
-2.396
-8.0%
jan 1, 1985
23.464
-4.087
-14.84%
jan 1, 1986
24.862
+1.398
5.96%
jan 1, 1987
28.169
+3.307
13.3%
jan 1, 1988
27.778
-0.391
-1.39%
jan 1, 1989
30.729
+2.951
10.63%
jan 1, 1990
32.164
+1.435
4.67%
jan 1, 1991
30.978
-1.185
-3.69%
jan 1, 1992
32.967
+1.989
6.42%
jan 1, 1993
36.321
+3.354
10.17%
jan 1, 1994
35.407
-0.914
-2.52%
jan 1, 1995
35.146
-0.26
-0.74%
jan 1, 1996
37.849
+2.702
7.69%
jan 1, 1997
37.97
+0.121
0.32%
jan 1, 1998
38.112
+0.142
0.37%
jan 1, 1999
44.048
+5.936
15.57%
jan 1, 2000
40.118
-3.93
-8.92%
jan 1, 2001
41.808
+1.69
4.21%
jan 1, 2002
43.666
+1.858
4.44%
jan 1, 2003
41.253
-2.413
-5.52%
jan 1, 2004
40.506
-0.747
-1.81%
jan 1, 2005
40.732
+0.225
0.56%
jan 1, 2006
38.958
-1.774
-4.36%
jan 1, 2007
39.858
+0.901
2.31%
jan 1, 2008
41.055
+1.197
3.0%
jan 1, 2009
40.095
-0.96
-2.34%
jan 1, 2010
43.405
+3.31
8.25%
jan 1, 2011
41.149
-2.256
-5.2%
jan 1, 2012
42.506
+1.356
3.3%
jan 1, 2013
38.6
-3.905
-9.19%
jan 1, 2014
35.867
-2.733
-7.08%
Ranking of countries by current statistics by years


Comments: