29
/
en
AIzaSyAYiBZKx7MnpbEhh9jyipgxe19OcubqV5w
April 1, 2024
202657
Mozambique
MOZ
true
2
1
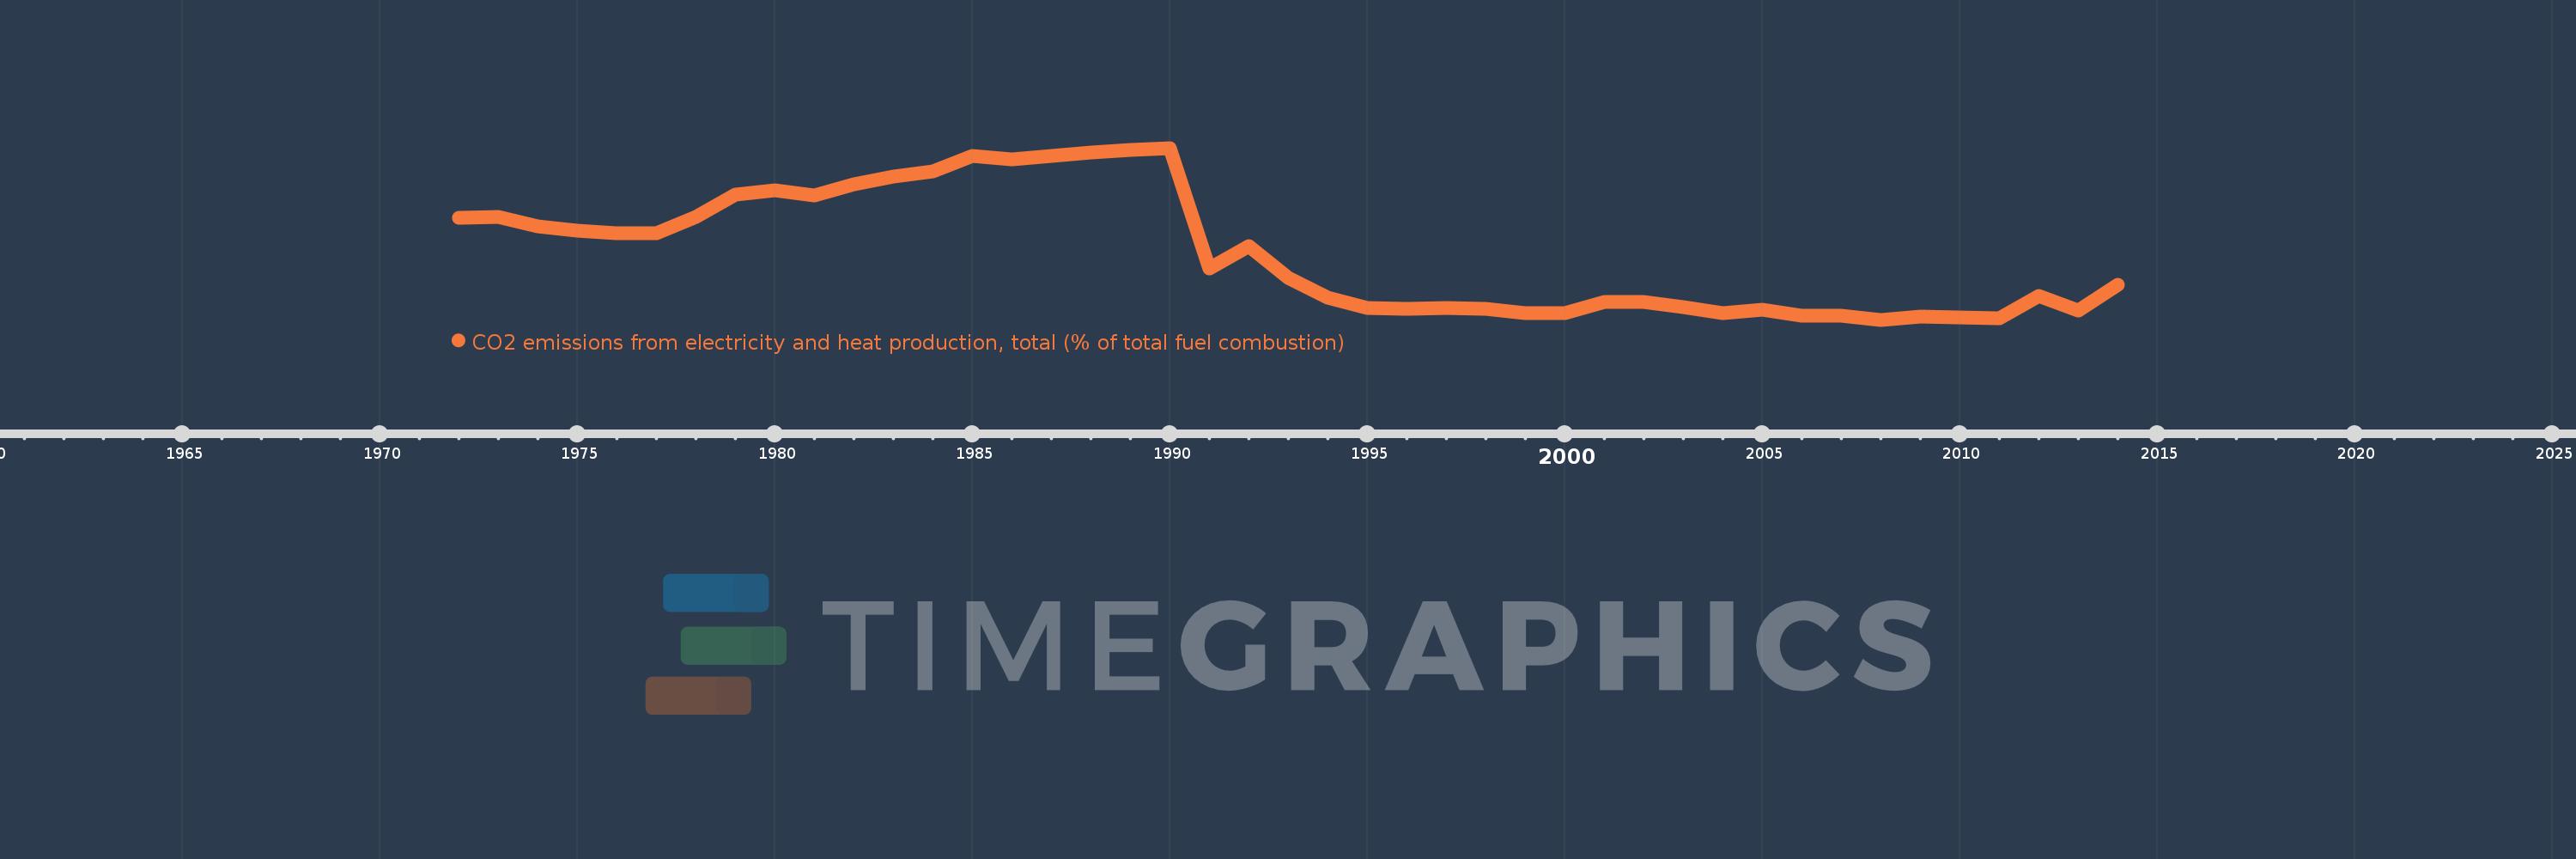
CO2 emissions from electricity and heat production, total (% of total fuel combustion)
2014,2013,2012,2011,2010,2009,2008,2007,2006,2005,2004,2003,2002,2001,2000,1999,1998,1997,1996,1995,1994,1993,1992,1991,1990,1989,1988,1987,1986,1985,1984,1983,1982,1981,1980,1979,1978,1977,1976,1975,1974,1973,1972
This statistics in other country:
AlbaniaAlgeriaAngolaArab WorldArgentinaArmeniaAustraliaAustriaAzerbaijanBahrainBangladeshBelarusBelgiumBeninBoliviaBosnia and HerzegovinaBotswanaBrazilBrunei DarussalamBulgariaCambodiaCameroonCanadaCaribbean small statesCentral Europe and the BalticsChileChinaColombiaCongo, Dem. Rep.Congo, Rep.Costa RicaCote d'IvoireCroatiaCubaCuracaoCyprusCzech RepublicDenmarkDominican RepublicEarly-demographic dividendEast Asia & PacificEast Asia & Pacific (excluding high income)East Asia & Pacific (IDA & IBRD countries)EcuadorEgypt, Arab Rep.El SalvadorEritreaEstoniaEthiopiaEuro areaEurope & Central AsiaEurope & Central Asia (excluding high income)Europe & Central Asia (IDA & IBRD countries)European UnionFinlandFragile and conflict affected situationsFranceGabonGeorgiaGermanyGhanaGibraltarGreeceGuatemalaHaitiHeavily indebted poor countries (HIPC)High incomeHondurasHong Kong SAR, ChinaHungaryIBRD onlyIcelandIDA & IBRD totalIDA blendIDA onlyIDA totalIndiaIndonesiaIran, Islamic Rep.IraqIrelandIsraelItalyJamaicaJapanJordanKazakhstanKenyaKorea, Dem. People’s Rep.Korea, Rep.KosovoKuwaitKyrgyz RepublicLate-demographic dividendLatin America & Caribbean Latin America & Caribbean (excluding high income)Latin America & the Caribbean (IDA & IBRD countries)LatviaLeast developed countries: UN classificationLebanonLibyaLithuaniaLow & middle incomeLow incomeLower middle incomeLuxembourgMacedonia, FYRMalaysiaMaltaMauritiusMexicoMiddle East & North AfricaMiddle East & North Africa (excluding high income)Middle East & North Africa (IDA & IBRD countries)Middle incomeMoldovaMongoliaMontenegroMoroccoMozambiqueMyanmarNamibiaNepalNetherlandsNew ZealandNicaraguaNigerNigeriaNorth AmericaNorwayOECD membersOmanOther small statesPakistanPanamaParaguayPeruPhilippinesPolandPortugalPost-demographic dividendPre-demographic dividendQatarRomaniaRussian FederationSaudi ArabiaSenegalSerbiaSingaporeSlovak RepublicSloveniaSmall statesSouth AfricaSouth AsiaSouth Asia (IDA & IBRD)South SudanSpainSri LankaSub-Saharan Africa Sub-Saharan Africa (excluding high income)Sub-Saharan Africa (IDA & IBRD countries)SudanSwedenSwitzerlandSyrian Arab RepublicTajikistanTanzaniaThailandTogoTrinidad and TobagoTunisiaTurkeyTurkmenistanUkraineUnited Arab EmiratesUnited KingdomUnited StatesUpper middle incomeUruguayUzbekistanVenezuela, RBVietnamWorldYemen, Rep.ZambiaZimbabwe Timeline:
This timeline shows a graph from 1972 to 2014 of Mozambique. No data until 1971. Number of actual observations by date: 43.
Source name:
World Development Indicators
Source organization:
IEA Statistics © OECD/IEA 2014 (http://www.iea.org/stats/index.asp), subject to https://www.iea.org/t&c/termsandconditions/
Categories, topics:
Environment
Last updated:
apr 23, 2017
Indicators value changes by year
Maximum:
32.877
jan 1, 1990
At the date of observation
Value
Absolute change
Change from previous value
jan 1, 1972
19.795
+19.795
0.0%
jan 1, 1973
19.925
+0.13
0.65%
jan 1, 1974
18.051
-1.874
-9.41%
jan 1, 1975
17.228
-0.822
-4.55%
jan 1, 1976
16.807
-0.422
-2.45%
jan 1, 1977
16.872
+0.066
0.39%
jan 1, 1978
19.913
+3.041
18.02%
jan 1, 1979
24.121
+4.207
21.13%
jan 1, 1980
24.868
+0.747
3.1%
jan 1, 1981
23.932
-0.936
-3.76%
jan 1, 1982
26.108
+2.177
9.1%
jan 1, 1983
27.419
+1.311
5.02%
jan 1, 1984
28.488
+1.069
3.9%
jan 1, 1985
31.293
+2.804
9.84%
jan 1, 1986
30.667
-0.626
-2.0%
jan 1, 1987
31.293
+0.626
2.04%
jan 1, 1988
31.973
+0.68
2.17%
jan 1, 1989
32.432
+0.46
1.44%
jan 1, 1990
32.877
+0.444
1.37%
jan 1, 1991
10.185
-22.692
-69.02%
jan 1, 1992
14.444
+4.259
41.82%
jan 1, 1993
8.333
-6.111
-42.31%
jan 1, 1994
4.688
-3.646
-43.75%
jan 1, 1995
2.804
-1.884
-40.19%
jan 1, 1996
2.609
-0.195
-6.96%
jan 1, 1997
2.752
+0.144
5.5%
jan 1, 1998
2.5
-0.252
-9.17%
jan 1, 1999
1.724
-0.776
-31.03%
jan 1, 2000
1.739
+0.015
0.87%
jan 1, 2001
3.788
+2.049
117.8%
jan 1, 2002
3.846
+0.058
1.54%
jan 1, 2003
2.92
-0.926
-24.09%
jan 1, 2004
1.807
-1.112
-38.1%
jan 1, 2005
2.367
+0.56
30.97%
jan 1, 2006
1.325
-1.042
-44.04%
jan 1, 2007
1.235
-0.09
-6.79%
jan 1, 2008
0.508
-0.727
-58.88%
jan 1, 2009
1.026
+0.518
102.05%
jan 1, 2010
0.905
-0.121
-11.76%
jan 1, 2011
0.84
-0.065
-7.14%
jan 1, 2012
4.965
+4.124
490.78%
jan 1, 2013
2.29
-2.674
-53.87%
jan 1, 2014
7.119
+4.829
210.85%
Ranking of countries by current statistics by years


Comments: