29
/
en
AIzaSyAYiBZKx7MnpbEhh9jyipgxe19OcubqV5w
April 1, 2024
240267
Singapore
SGP
true
2
1
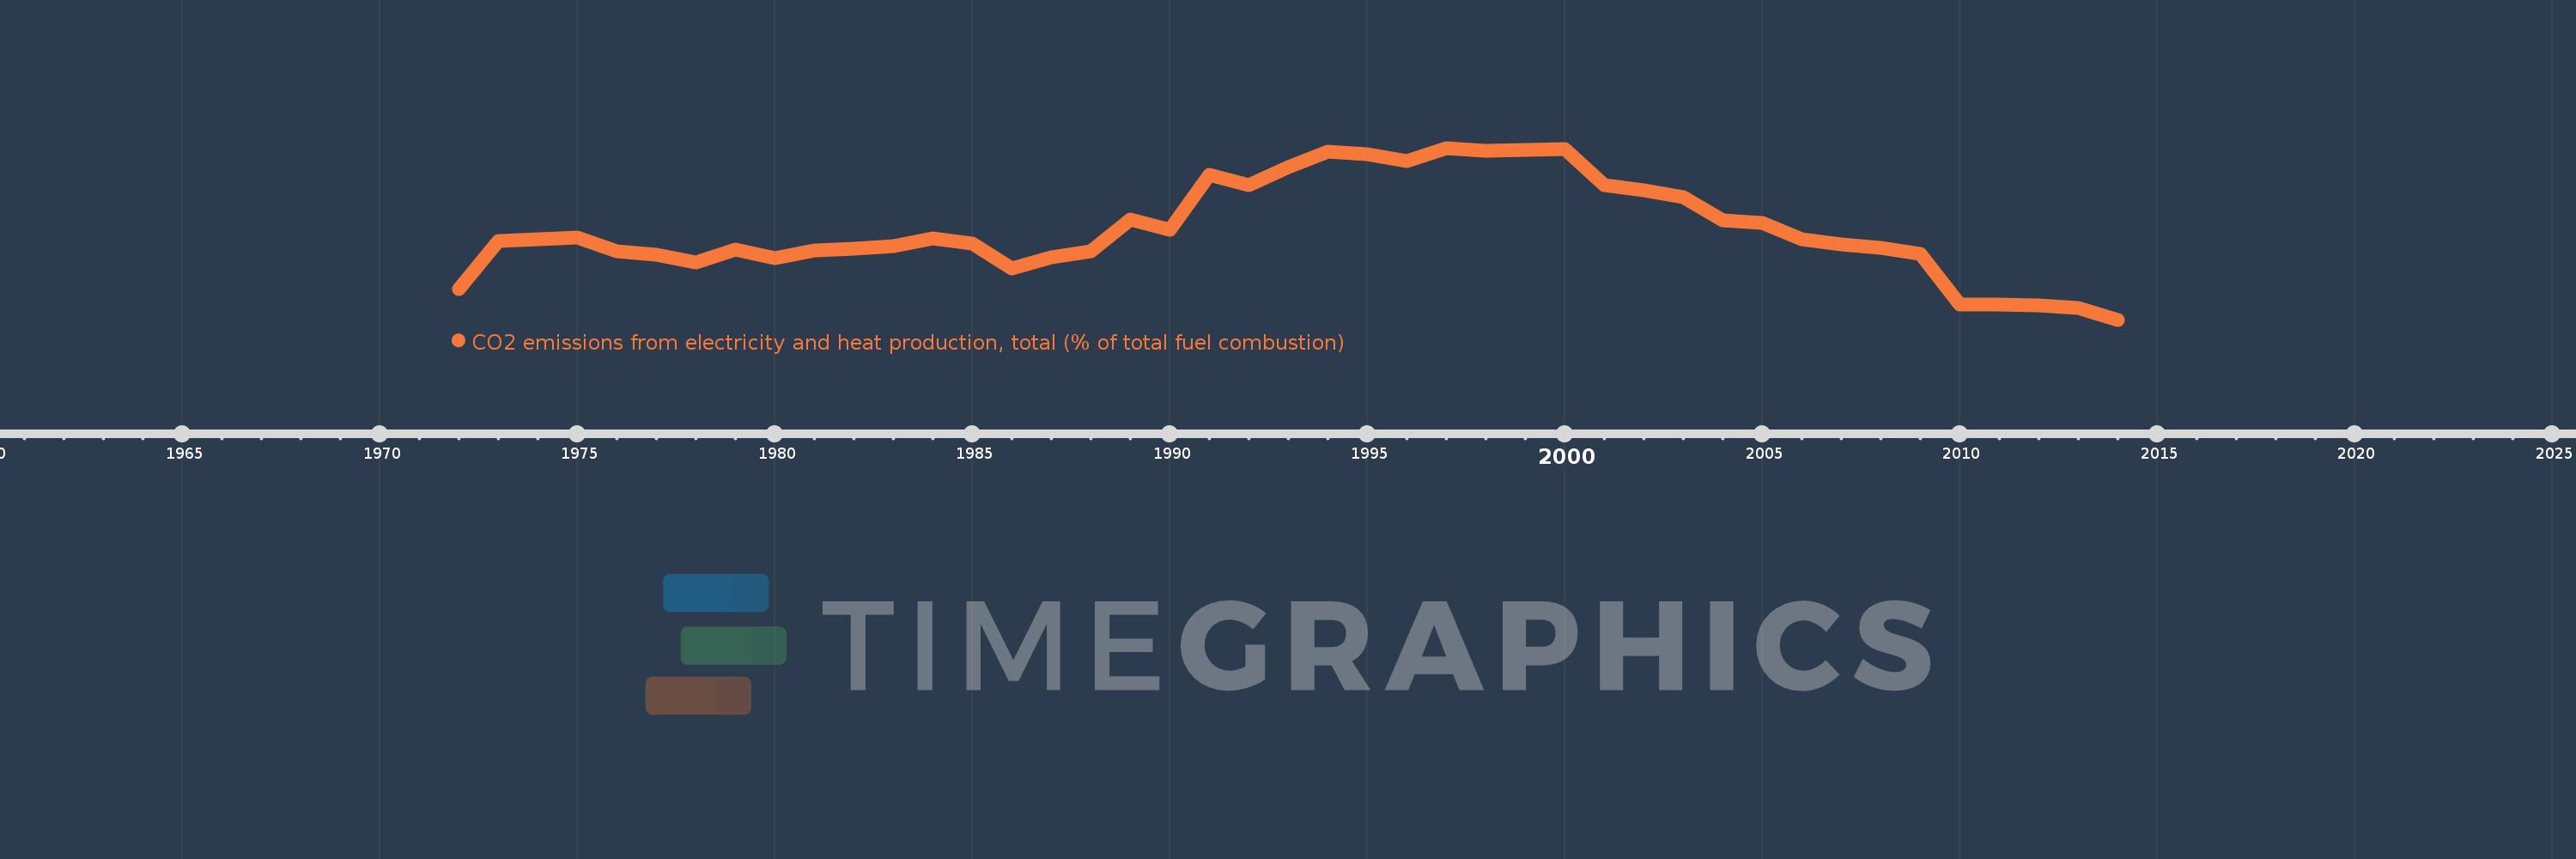
CO2 emissions from electricity and heat production, total (% of total fuel combustion)
2014,2013,2012,2011,2010,2009,2008,2007,2006,2005,2004,2003,2002,2001,2000,1999,1998,1997,1996,1995,1994,1993,1992,1991,1990,1989,1988,1987,1986,1985,1984,1983,1982,1981,1980,1979,1978,1977,1976,1975,1974,1973,1972
This statistics in other country:
AlbaniaAlgeriaAngolaArab WorldArgentinaArmeniaAustraliaAustriaAzerbaijanBahrainBangladeshBelarusBelgiumBeninBoliviaBosnia and HerzegovinaBotswanaBrazilBrunei DarussalamBulgariaCambodiaCameroonCanadaCaribbean small statesCentral Europe and the BalticsChileChinaColombiaCongo, Dem. Rep.Congo, Rep.Costa RicaCote d'IvoireCroatiaCubaCuracaoCyprusCzech RepublicDenmarkDominican RepublicEarly-demographic dividendEast Asia & PacificEast Asia & Pacific (excluding high income)East Asia & Pacific (IDA & IBRD countries)EcuadorEgypt, Arab Rep.El SalvadorEritreaEstoniaEthiopiaEuro areaEurope & Central AsiaEurope & Central Asia (excluding high income)Europe & Central Asia (IDA & IBRD countries)European UnionFinlandFragile and conflict affected situationsFranceGabonGeorgiaGermanyGhanaGibraltarGreeceGuatemalaHaitiHeavily indebted poor countries (HIPC)High incomeHondurasHong Kong SAR, ChinaHungaryIBRD onlyIcelandIDA & IBRD totalIDA blendIDA onlyIDA totalIndiaIndonesiaIran, Islamic Rep.IraqIrelandIsraelItalyJamaicaJapanJordanKazakhstanKenyaKorea, Dem. People’s Rep.Korea, Rep.KosovoKuwaitKyrgyz RepublicLate-demographic dividendLatin America & Caribbean Latin America & Caribbean (excluding high income)Latin America & the Caribbean (IDA & IBRD countries)LatviaLeast developed countries: UN classificationLebanonLibyaLithuaniaLow & middle incomeLow incomeLower middle incomeLuxembourgMacedonia, FYRMalaysiaMaltaMauritiusMexicoMiddle East & North AfricaMiddle East & North Africa (excluding high income)Middle East & North Africa (IDA & IBRD countries)Middle incomeMoldovaMongoliaMontenegroMoroccoMozambiqueMyanmarNamibiaNepalNetherlandsNew ZealandNicaraguaNigerNigeriaNorth AmericaNorwayOECD membersOmanOther small statesPakistanPanamaParaguayPeruPhilippinesPolandPortugalPost-demographic dividendPre-demographic dividendQatarRomaniaRussian FederationSaudi ArabiaSenegalSerbiaSingaporeSlovak RepublicSloveniaSmall statesSouth AfricaSouth AsiaSouth Asia (IDA & IBRD)South SudanSpainSri LankaSub-Saharan Africa Sub-Saharan Africa (excluding high income)Sub-Saharan Africa (IDA & IBRD countries)SudanSwedenSwitzerlandSyrian Arab RepublicTajikistanTanzaniaThailandTogoTrinidad and TobagoTunisiaTurkeyTurkmenistanUkraineUnited Arab EmiratesUnited KingdomUnited StatesUpper middle incomeUruguayUzbekistanVenezuela, RBVietnamWorldYemen, Rep.ZambiaZimbabwe Timeline:
This timeline shows a graph from 1972 to 2014 of Singapore. No data until 1971. Number of actual observations by date: 43.
Source name:
World Development Indicators
Source organization:
IEA Statistics © OECD/IEA 2014 (http://www.iea.org/stats/index.asp), subject to https://www.iea.org/t&c/termsandconditions/
Categories, topics:
Environment
Last updated:
apr 23, 2017
Indicators value changes by year
Minimum:
57.904
jan 1, 2014
Maximum:
84.026
jan 1, 1997
At the date of observation
Value
Absolute change
Change from previous value
jan 1, 1972
62.541
+62.541
0.0%
jan 1, 1973
69.945
+7.403
11.84%
jan 1, 1974
70.197
+0.252
0.36%
jan 1, 1975
70.449
+0.252
0.36%
jan 1, 1976
68.365
-2.084
-2.96%
jan 1, 1977
67.763
-0.602
-0.88%
jan 1, 1978
66.601
-1.162
-1.71%
jan 1, 1979
68.511
+1.909
2.87%
jan 1, 1980
67.245
-1.265
-1.85%
jan 1, 1981
68.458
+1.213
1.8%
jan 1, 1982
68.736
+0.278
0.41%
jan 1, 1983
69.071
+0.335
0.49%
jan 1, 1984
70.218
+1.147
1.66%
jan 1, 1985
69.535
-0.684
-0.97%
jan 1, 1986
65.723
-3.812
-5.48%
jan 1, 1987
67.42
+1.697
2.58%
jan 1, 1988
68.253
+0.833
1.24%
jan 1, 1989
73.198
+4.945
7.24%
jan 1, 1990
71.632
-1.566
-2.14%
jan 1, 1991
79.903
+8.271
11.55%
jan 1, 1992
78.365
-1.538
-1.93%
jan 1, 1993
81.109
+2.744
3.5%
jan 1, 1994
83.513
+2.405
2.96%
jan 1, 1995
83.061
-0.452
-0.54%
jan 1, 1996
82.06
-1.001
-1.21%
jan 1, 1997
84.026
+1.966
2.4%
jan 1, 1998
83.539
-0.487
-0.58%
jan 1, 1999
83.693
+0.155
0.19%
jan 1, 2000
83.915
+0.222
0.27%
jan 1, 2001
78.371
-5.544
-6.61%
jan 1, 2002
77.64
-0.731
-0.93%
jan 1, 2003
76.586
-1.054
-1.36%
jan 1, 2004
73.042
-3.544
-4.63%
jan 1, 2005
72.64
-0.402
-0.55%
jan 1, 2006
70.153
-2.487
-3.42%
jan 1, 2007
69.41
-0.744
-1.06%
jan 1, 2008
68.86
-0.55
-0.79%
jan 1, 2009
67.913
-0.946
-1.37%
jan 1, 2010
60.228
-7.685
-11.32%
jan 1, 2011
60.199
-0.029
-0.05%
jan 1, 2012
60.026
-0.173
-0.29%
jan 1, 2013
59.731
-0.294
-0.49%
jan 1, 2014
57.904
-1.827
-3.06%
Ranking of countries by current statistics by years


Comments: