29
/
en
AIzaSyAYiBZKx7MnpbEhh9jyipgxe19OcubqV5w
April 1, 2024
113342
Cote d'Ivoire
CIV
true
2
1
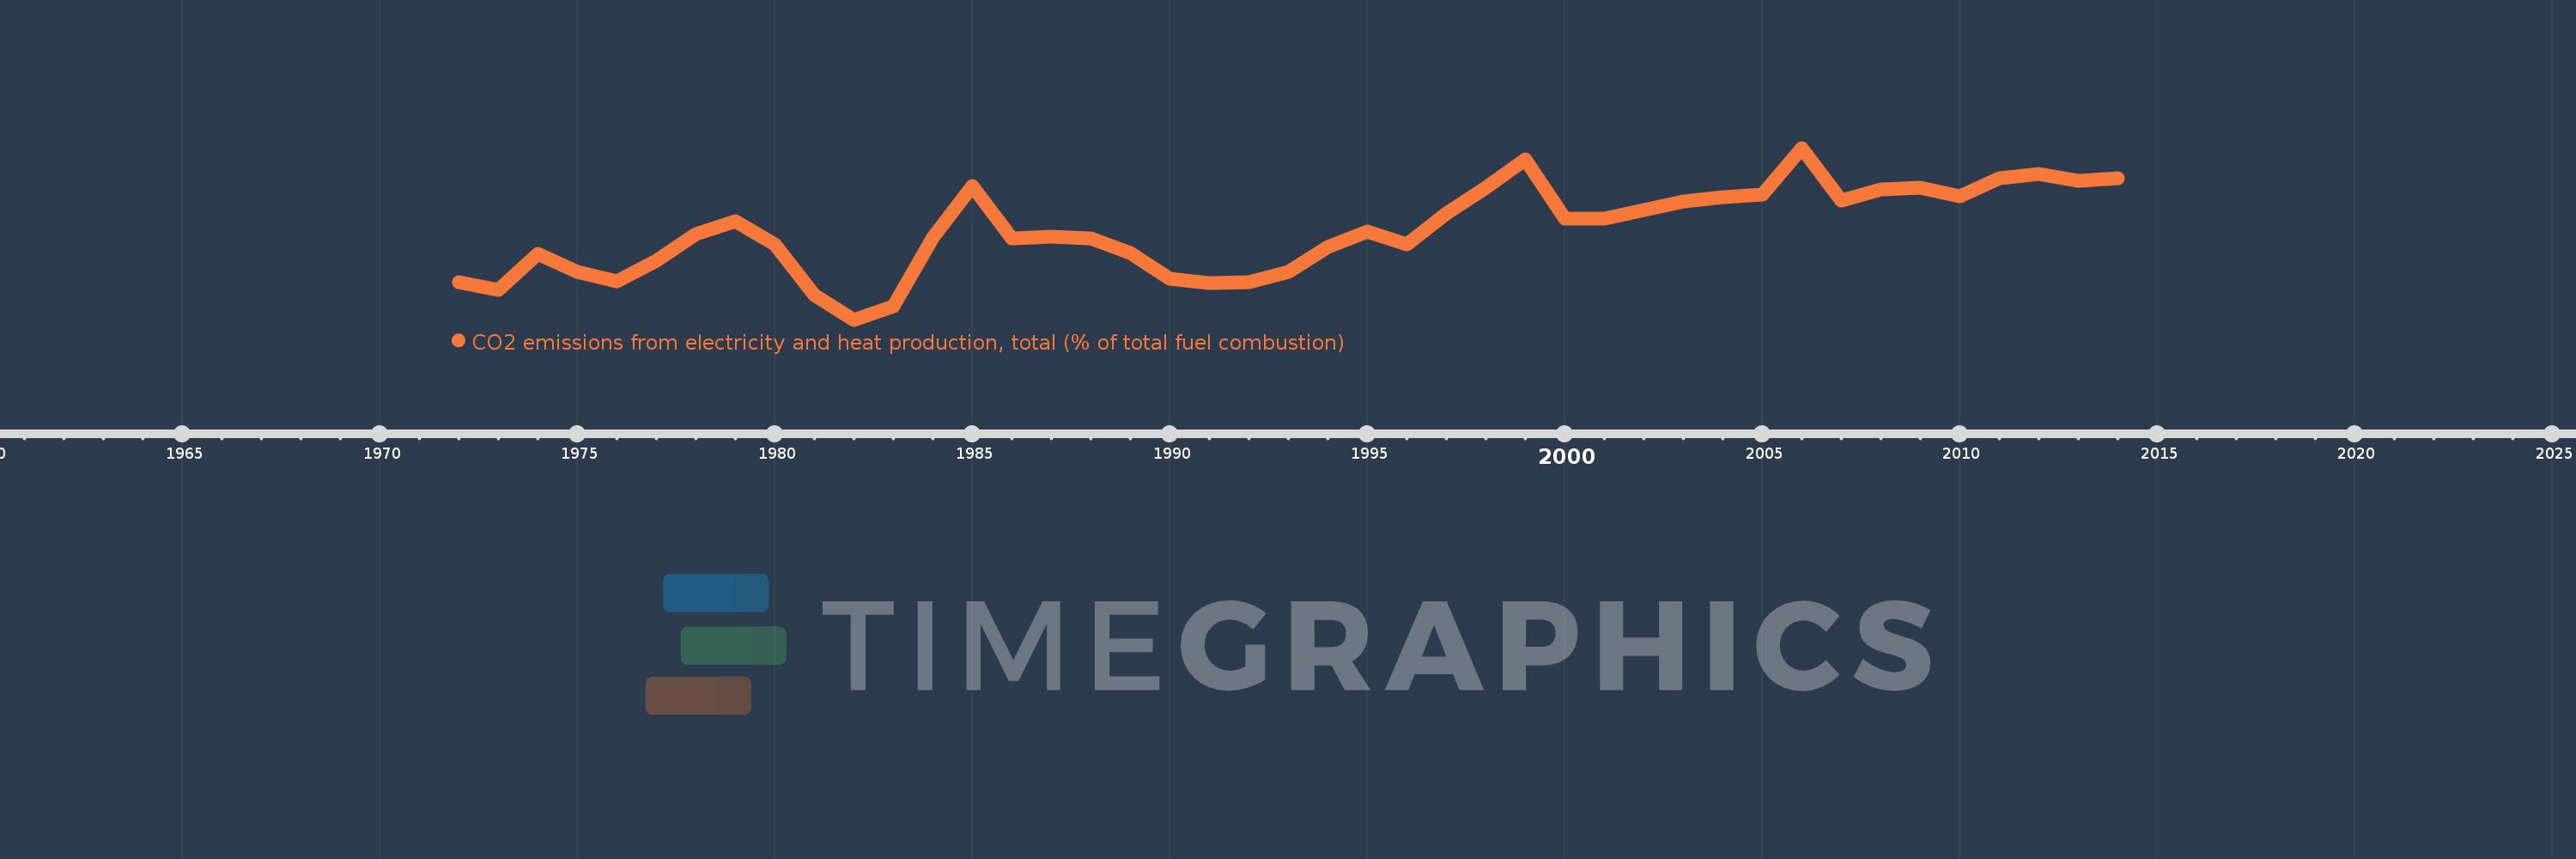
CO2 emissions from electricity and heat production, total (% of total fuel combustion)
2014,2013,2012,2011,2010,2009,2008,2007,2006,2005,2004,2003,2002,2001,2000,1999,1998,1997,1996,1995,1994,1993,1992,1991,1990,1989,1988,1987,1986,1985,1984,1983,1982,1981,1980,1979,1978,1977,1976,1975,1974,1973,1972
This statistics in other country:
AlbaniaAlgeriaAngolaArab WorldArgentinaArmeniaAustraliaAustriaAzerbaijanBahrainBangladeshBelarusBelgiumBeninBoliviaBosnia and HerzegovinaBotswanaBrazilBrunei DarussalamBulgariaCambodiaCameroonCanadaCaribbean small statesCentral Europe and the BalticsChileChinaColombiaCongo, Dem. Rep.Congo, Rep.Costa RicaCote d'IvoireCroatiaCubaCuracaoCyprusCzech RepublicDenmarkDominican RepublicEarly-demographic dividendEast Asia & PacificEast Asia & Pacific (excluding high income)East Asia & Pacific (IDA & IBRD countries)EcuadorEgypt, Arab Rep.El SalvadorEritreaEstoniaEthiopiaEuro areaEurope & Central AsiaEurope & Central Asia (excluding high income)Europe & Central Asia (IDA & IBRD countries)European UnionFinlandFragile and conflict affected situationsFranceGabonGeorgiaGermanyGhanaGibraltarGreeceGuatemalaHaitiHeavily indebted poor countries (HIPC)High incomeHondurasHong Kong SAR, ChinaHungaryIBRD onlyIcelandIDA & IBRD totalIDA blendIDA onlyIDA totalIndiaIndonesiaIran, Islamic Rep.IraqIrelandIsraelItalyJamaicaJapanJordanKazakhstanKenyaKorea, Dem. People’s Rep.Korea, Rep.KosovoKuwaitKyrgyz RepublicLate-demographic dividendLatin America & Caribbean Latin America & Caribbean (excluding high income)Latin America & the Caribbean (IDA & IBRD countries)LatviaLeast developed countries: UN classificationLebanonLibyaLithuaniaLow & middle incomeLow incomeLower middle incomeLuxembourgMacedonia, FYRMalaysiaMaltaMauritiusMexicoMiddle East & North AfricaMiddle East & North Africa (excluding high income)Middle East & North Africa (IDA & IBRD countries)Middle incomeMoldovaMongoliaMontenegroMoroccoMozambiqueMyanmarNamibiaNepalNetherlandsNew ZealandNicaraguaNigerNigeriaNorth AmericaNorwayOECD membersOmanOther small statesPakistanPanamaParaguayPeruPhilippinesPolandPortugalPost-demographic dividendPre-demographic dividendQatarRomaniaRussian FederationSaudi ArabiaSenegalSerbiaSingaporeSlovak RepublicSloveniaSmall statesSouth AfricaSouth AsiaSouth Asia (IDA & IBRD)South SudanSpainSri LankaSub-Saharan Africa Sub-Saharan Africa (excluding high income)Sub-Saharan Africa (IDA & IBRD countries)SudanSwedenSwitzerlandSyrian Arab RepublicTajikistanTanzaniaThailandTogoTrinidad and TobagoTunisiaTurkeyTurkmenistanUkraineUnited Arab EmiratesUnited KingdomUnited StatesUpper middle incomeUruguayUzbekistanVenezuela, RBVietnamWorldYemen, Rep.ZambiaZimbabwe Timeline:
This timeline shows a graph from 1972 to 2014 of Cote d'Ivoire. No data until 1971. Number of actual observations by date: 43.
Source name:
World Development Indicators
Source organization:
IEA Statistics © OECD/IEA 2014 (http://www.iea.org/stats/index.asp), subject to https://www.iea.org/t&c/termsandconditions/
Categories, topics:
Environment
Last updated:
apr 23, 2017
Indicators value changes by year
Minimum:
13.712
jan 1, 1982
Maximum:
53.873
jan 1, 2006
At the date of observation
Value
Absolute change
Change from previous value
jan 1, 1972
22.5
+22.5
0.0%
jan 1, 1973
20.755
-1.745
-7.76%
jan 1, 1974
29.151
+8.397
40.46%
jan 1, 1975
24.911
-4.24
-14.55%
jan 1, 1976
22.697
-2.214
-8.89%
jan 1, 1977
27.586
+4.889
21.54%
jan 1, 1978
33.724
+6.138
22.25%
jan 1, 1979
36.683
+2.959
8.77%
jan 1, 1980
31.233
-5.451
-14.86%
jan 1, 1981
19.469
-11.764
-37.66%
jan 1, 1982
13.712
-5.757
-29.57%
jan 1, 1983
16.892
+3.18
23.19%
jan 1, 1984
32.888
+15.996
94.7%
jan 1, 1985
44.91
+12.022
36.56%
jan 1, 1986
32.787
-12.123
-26.99%
jan 1, 1987
33.117
+0.33
1.01%
jan 1, 1988
32.787
-0.33
-1.0%
jan 1, 1989
29.412
-3.375
-10.29%
jan 1, 1990
23.208
-6.204
-21.09%
jan 1, 1991
22.222
-0.986
-4.25%
jan 1, 1992
22.581
+0.358
1.61%
jan 1, 1993
24.91
+2.329
10.31%
jan 1, 1994
30.743
+5.833
23.42%
jan 1, 1995
34.304
+3.561
11.58%
jan 1, 1996
31.288
-3.016
-8.79%
jan 1, 1997
38.501
+7.213
23.05%
jan 1, 1998
44.561
+6.059
15.74%
jan 1, 1999
51.139
+6.578
14.76%
jan 1, 2000
37.369
-13.77
-26.93%
jan 1, 2001
37.441
+0.072
0.19%
jan 1, 2002
39.297
+1.856
4.96%
jan 1, 2003
41.379
+2.082
5.3%
jan 1, 2004
42.33
+0.951
2.3%
jan 1, 2005
42.989
+0.659
1.56%
jan 1, 2006
53.873
+10.884
25.32%
jan 1, 2007
41.563
-12.31
-22.85%
jan 1, 2008
44.144
+2.581
6.21%
jan 1, 2009
44.654
+0.51
1.16%
jan 1, 2010
42.568
-2.087
-4.67%
jan 1, 2011
46.86
+4.292
10.08%
jan 1, 2012
47.782
+0.922
1.97%
jan 1, 2013
46.193
-1.589
-3.32%
jan 1, 2014
46.774
+0.581
1.26%
Ranking of countries by current statistics by years


Comments: