29
/
en
AIzaSyAYiBZKx7MnpbEhh9jyipgxe19OcubqV5w
April 1, 2024
242388
Slovenia
SVN
true
2
1
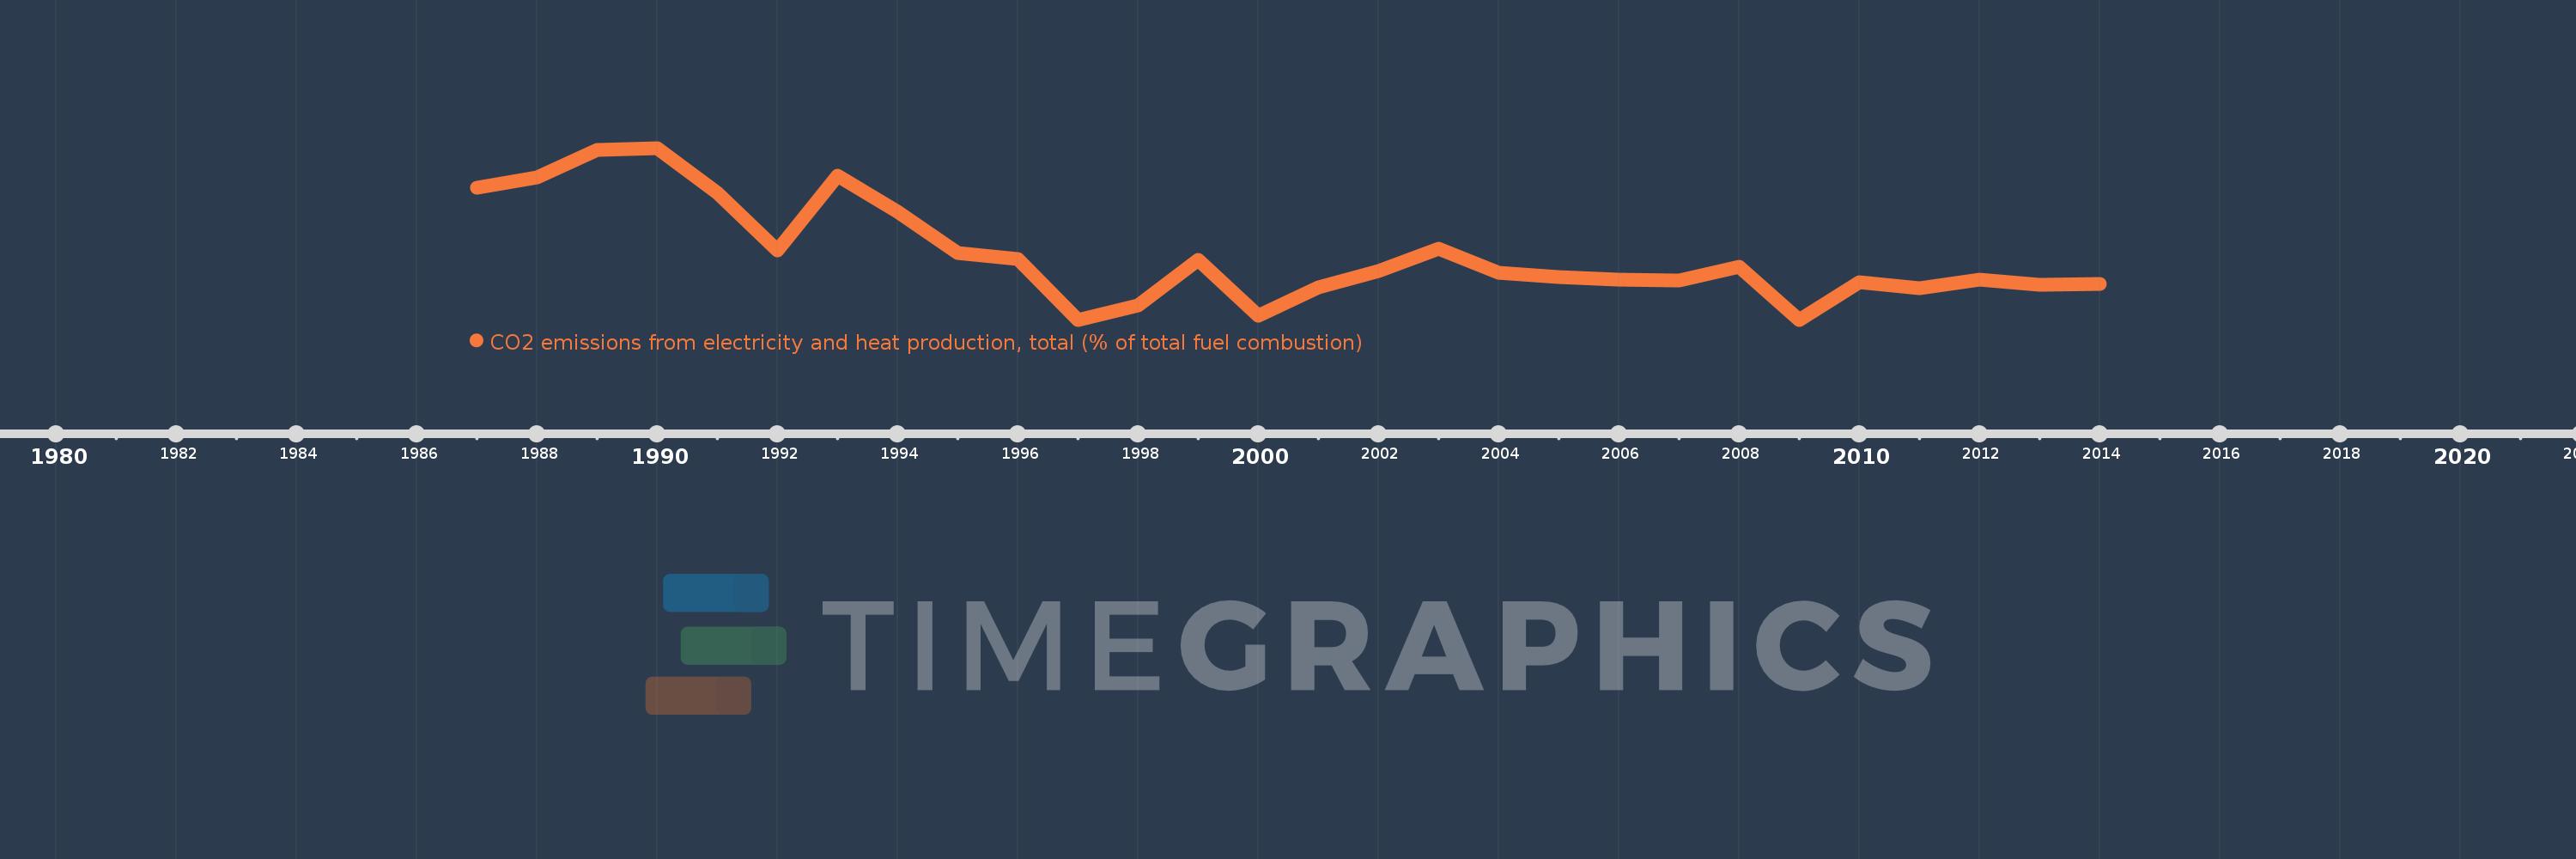
CO2 emissions from electricity and heat production, total (% of total fuel combustion)
2014,2013,2012,2011,2010,2009,2008,2007,2006,2005,2004,2003,2002,2001,2000,1999,1998,1997,1996,1995,1994,1993,1992,1991,1990,1989,1988,1987
This statistics in other country:
AlbaniaAlgeriaAngolaArab WorldArgentinaArmeniaAustraliaAustriaAzerbaijanBahrainBangladeshBelarusBelgiumBeninBoliviaBosnia and HerzegovinaBotswanaBrazilBrunei DarussalamBulgariaCambodiaCameroonCanadaCaribbean small statesCentral Europe and the BalticsChileChinaColombiaCongo, Dem. Rep.Congo, Rep.Costa RicaCote d'IvoireCroatiaCubaCuracaoCyprusCzech RepublicDenmarkDominican RepublicEarly-demographic dividendEast Asia & PacificEast Asia & Pacific (excluding high income)East Asia & Pacific (IDA & IBRD countries)EcuadorEgypt, Arab Rep.El SalvadorEritreaEstoniaEthiopiaEuro areaEurope & Central AsiaEurope & Central Asia (excluding high income)Europe & Central Asia (IDA & IBRD countries)European UnionFinlandFragile and conflict affected situationsFranceGabonGeorgiaGermanyGhanaGibraltarGreeceGuatemalaHaitiHeavily indebted poor countries (HIPC)High incomeHondurasHong Kong SAR, ChinaHungaryIBRD onlyIcelandIDA & IBRD totalIDA blendIDA onlyIDA totalIndiaIndonesiaIran, Islamic Rep.IraqIrelandIsraelItalyJamaicaJapanJordanKazakhstanKenyaKorea, Dem. People’s Rep.Korea, Rep.KosovoKuwaitKyrgyz RepublicLate-demographic dividendLatin America & Caribbean Latin America & Caribbean (excluding high income)Latin America & the Caribbean (IDA & IBRD countries)LatviaLeast developed countries: UN classificationLebanonLibyaLithuaniaLow & middle incomeLow incomeLower middle incomeLuxembourgMacedonia, FYRMalaysiaMaltaMauritiusMexicoMiddle East & North AfricaMiddle East & North Africa (excluding high income)Middle East & North Africa (IDA & IBRD countries)Middle incomeMoldovaMongoliaMontenegroMoroccoMozambiqueMyanmarNamibiaNepalNetherlandsNew ZealandNicaraguaNigerNigeriaNorth AmericaNorwayOECD membersOmanOther small statesPakistanPanamaParaguayPeruPhilippinesPolandPortugalPost-demographic dividendPre-demographic dividendQatarRomaniaRussian FederationSaudi ArabiaSenegalSerbiaSingaporeSlovak RepublicSloveniaSmall statesSouth AfricaSouth AsiaSouth Asia (IDA & IBRD)South SudanSpainSri LankaSub-Saharan Africa Sub-Saharan Africa (excluding high income)Sub-Saharan Africa (IDA & IBRD countries)SudanSwedenSwitzerlandSyrian Arab RepublicTajikistanTanzaniaThailandTogoTrinidad and TobagoTunisiaTurkeyTurkmenistanUkraineUnited Arab EmiratesUnited KingdomUnited StatesUpper middle incomeUruguayUzbekistanVenezuela, RBVietnamWorldYemen, Rep.ZambiaZimbabwe Timeline:
This timeline shows a graph from 1987 to 2014 of Slovenia. No data until 1986. Number of actual observations by date: 28.
Source name:
World Development Indicators
Source organization:
IEA Statistics © OECD/IEA 2014 (http://www.iea.org/stats/index.asp), subject to https://www.iea.org/t&c/termsandconditions/
Categories, topics:
Environment
Last updated:
apr 23, 2017
Indicators value changes by year
Minimum:
38.089
jan 1, 1997
At the date of observation
Value
Absolute change
Change from previous value
jan 1, 1987
47.103
+47.103
0.0%
jan 1, 1988
47.801
+0.698
1.48%
jan 1, 1989
49.676
+1.875
3.92%
jan 1, 1990
49.82
+0.144
0.29%
jan 1, 1991
46.75
-3.07
-6.16%
jan 1, 1992
42.824
-3.927
-8.4%
jan 1, 1993
47.952
+5.128
11.98%
jan 1, 1994
45.482
-2.47
-5.15%
jan 1, 1995
42.63
-2.852
-6.27%
jan 1, 1996
42.217
-0.413
-0.97%
jan 1, 1997
38.089
-4.129
-9.78%
jan 1, 1998
39.045
+0.956
2.51%
jan 1, 1999
42.193
+3.148
8.06%
jan 1, 2000
38.339
-3.854
-9.13%
jan 1, 2001
40.327
+1.988
5.19%
jan 1, 2002
41.398
+1.071
2.65%
jan 1, 2003
42.942
+1.544
3.73%
jan 1, 2004
41.283
-1.66
-3.87%
jan 1, 2005
41.01
-0.272
-0.66%
jan 1, 2006
40.841
-0.169
-0.41%
jan 1, 2007
40.797
-0.044
-0.11%
jan 1, 2008
41.704
+0.907
2.22%
jan 1, 2009
38.09
-3.614
-8.67%
jan 1, 2010
40.652
+2.562
6.73%
jan 1, 2011
40.259
-0.393
-0.97%
jan 1, 2012
40.83
+0.571
1.42%
jan 1, 2013
40.484
-0.345
-0.85%
jan 1, 2014
40.516
+0.032
0.08%
Ranking of countries by current statistics by years


Comments: