29
/
en
AIzaSyAYiBZKx7MnpbEhh9jyipgxe19OcubqV5w
April 1, 2024
221926
Peru
PER
true
2
1
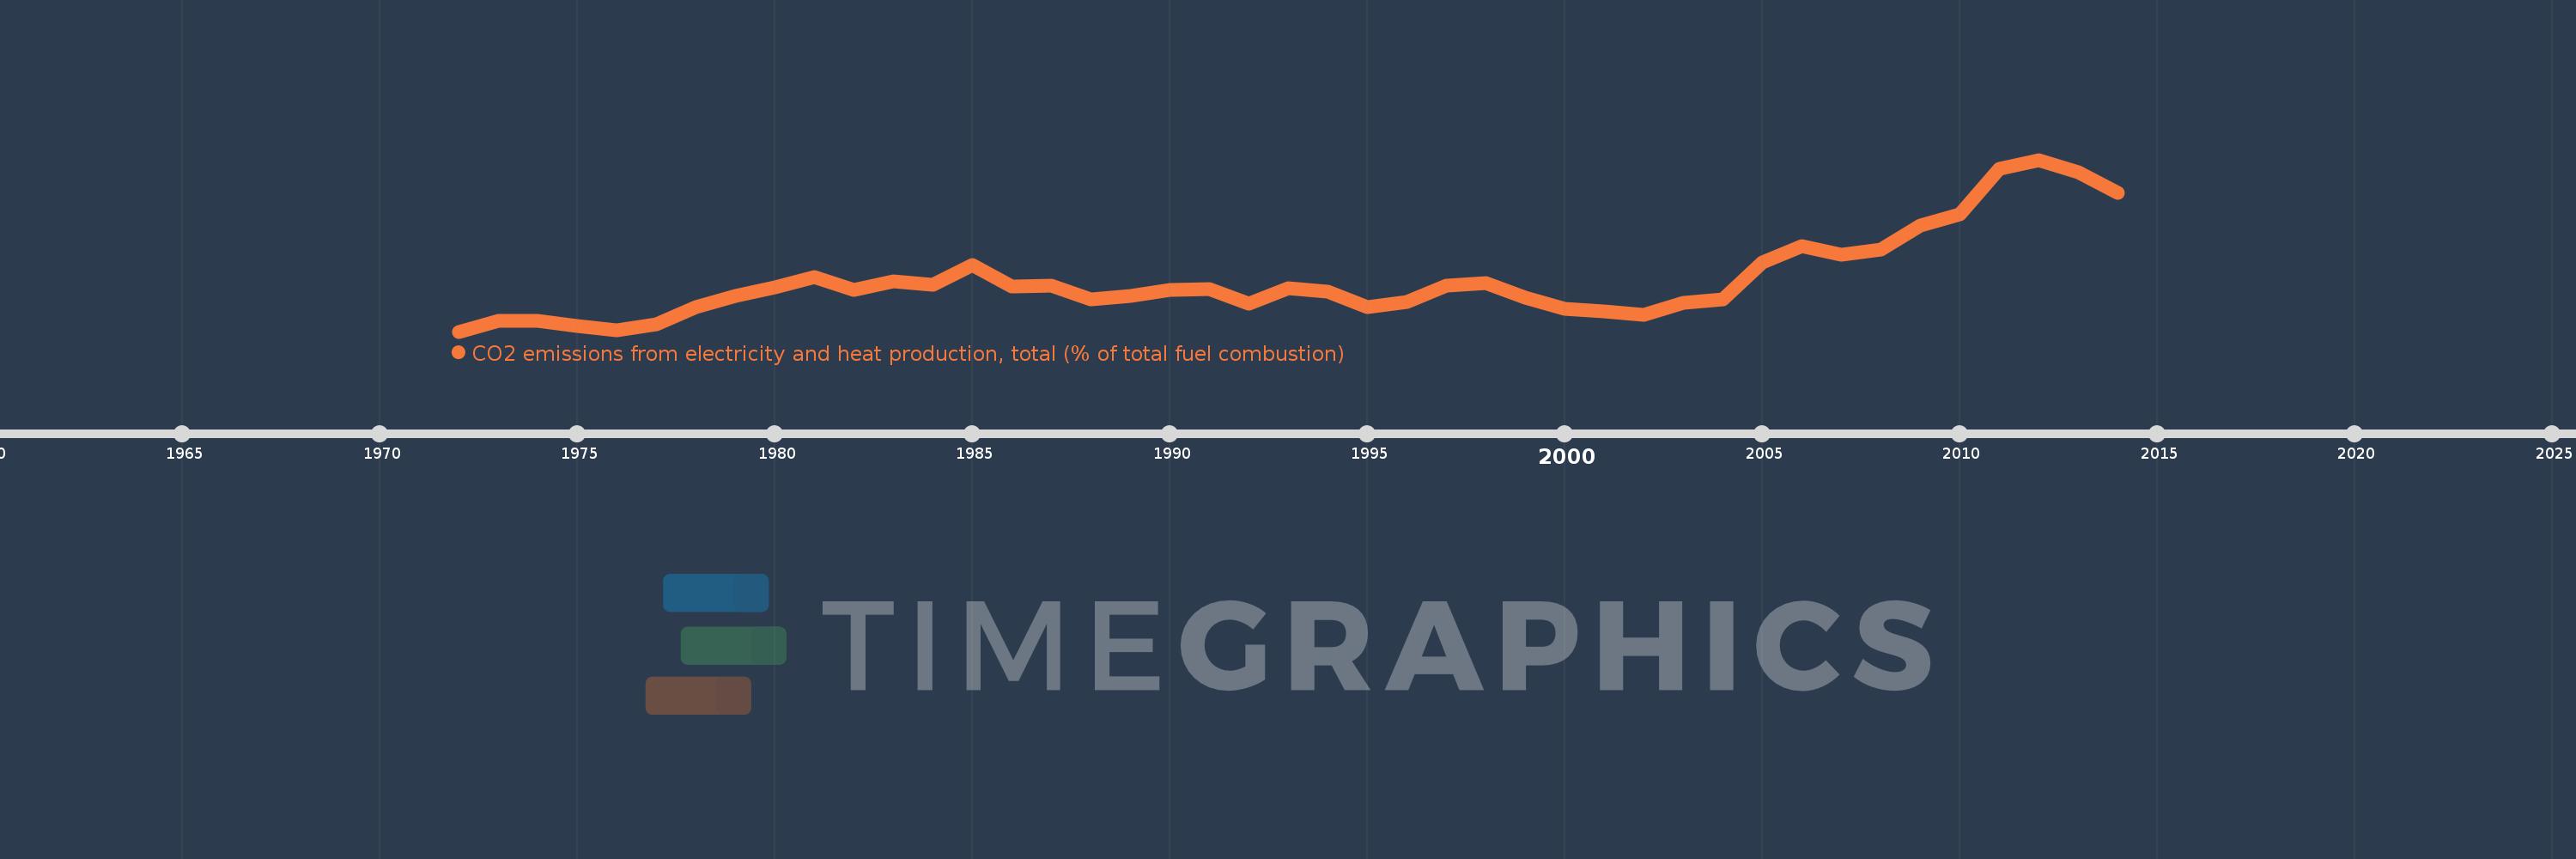
CO2 emissions from electricity and heat production, total (% of total fuel combustion)
2014,2013,2012,2011,2010,2009,2008,2007,2006,2005,2004,2003,2002,2001,2000,1999,1998,1997,1996,1995,1994,1993,1992,1991,1990,1989,1988,1987,1986,1985,1984,1983,1982,1981,1980,1979,1978,1977,1976,1975,1974,1973,1972
This statistics in other country:
AlbaniaAlgeriaAngolaArab WorldArgentinaArmeniaAustraliaAustriaAzerbaijanBahrainBangladeshBelarusBelgiumBeninBoliviaBosnia and HerzegovinaBotswanaBrazilBrunei DarussalamBulgariaCambodiaCameroonCanadaCaribbean small statesCentral Europe and the BalticsChileChinaColombiaCongo, Dem. Rep.Congo, Rep.Costa RicaCote d'IvoireCroatiaCubaCuracaoCyprusCzech RepublicDenmarkDominican RepublicEarly-demographic dividendEast Asia & PacificEast Asia & Pacific (excluding high income)East Asia & Pacific (IDA & IBRD countries)EcuadorEgypt, Arab Rep.El SalvadorEritreaEstoniaEthiopiaEuro areaEurope & Central AsiaEurope & Central Asia (excluding high income)Europe & Central Asia (IDA & IBRD countries)European UnionFinlandFragile and conflict affected situationsFranceGabonGeorgiaGermanyGhanaGibraltarGreeceGuatemalaHaitiHeavily indebted poor countries (HIPC)High incomeHondurasHong Kong SAR, ChinaHungaryIBRD onlyIcelandIDA & IBRD totalIDA blendIDA onlyIDA totalIndiaIndonesiaIran, Islamic Rep.IraqIrelandIsraelItalyJamaicaJapanJordanKazakhstanKenyaKorea, Dem. People’s Rep.Korea, Rep.KosovoKuwaitKyrgyz RepublicLate-demographic dividendLatin America & Caribbean Latin America & Caribbean (excluding high income)Latin America & the Caribbean (IDA & IBRD countries)LatviaLeast developed countries: UN classificationLebanonLibyaLithuaniaLow & middle incomeLow incomeLower middle incomeLuxembourgMacedonia, FYRMalaysiaMaltaMauritiusMexicoMiddle East & North AfricaMiddle East & North Africa (excluding high income)Middle East & North Africa (IDA & IBRD countries)Middle incomeMoldovaMongoliaMontenegroMoroccoMozambiqueMyanmarNamibiaNepalNetherlandsNew ZealandNicaraguaNigerNigeriaNorth AmericaNorwayOECD membersOmanOther small statesPakistanPanamaParaguayPeruPhilippinesPolandPortugalPost-demographic dividendPre-demographic dividendQatarRomaniaRussian FederationSaudi ArabiaSenegalSerbiaSingaporeSlovak RepublicSloveniaSmall statesSouth AfricaSouth AsiaSouth Asia (IDA & IBRD)South SudanSpainSri LankaSub-Saharan Africa Sub-Saharan Africa (excluding high income)Sub-Saharan Africa (IDA & IBRD countries)SudanSwedenSwitzerlandSyrian Arab RepublicTajikistanTanzaniaThailandTogoTrinidad and TobagoTunisiaTurkeyTurkmenistanUkraineUnited Arab EmiratesUnited KingdomUnited StatesUpper middle incomeUruguayUzbekistanVenezuela, RBVietnamWorldYemen, Rep.ZambiaZimbabwe Timeline:
This timeline shows a graph from 1972 to 2014 of Peru. No data until 1971. Number of actual observations by date: 43.
Source name:
World Development Indicators
Source organization:
IEA Statistics © OECD/IEA 2014 (http://www.iea.org/stats/index.asp), subject to https://www.iea.org/t&c/termsandconditions/
Categories, topics:
Environment
Last updated:
apr 23, 2017
Indicators value changes by year
Minimum:
15.735
jan 1, 1972
Maximum:
36.092
jan 1, 2012
At the date of observation
Value
Absolute change
Change from previous value
jan 1, 1972
15.735
+15.735
0.0%
jan 1, 1973
17.013
+1.278
8.12%
jan 1, 1974
16.985
-0.028
-0.17%
jan 1, 1975
16.419
-0.566
-3.33%
jan 1, 1976
15.853
-0.566
-3.45%
jan 1, 1977
16.64
+0.787
4.96%
jan 1, 1978
18.592
+1.952
11.73%
jan 1, 1979
19.946
+1.354
7.28%
jan 1, 1980
20.948
+1.003
5.03%
jan 1, 1981
22.168
+1.219
5.82%
jan 1, 1982
20.669
-1.499
-6.76%
jan 1, 1983
21.652
+0.984
4.76%
jan 1, 1984
21.272
-0.381
-1.76%
jan 1, 1985
23.615
+2.343
11.01%
jan 1, 1986
21.108
-2.507
-10.62%
jan 1, 1987
21.222
+0.113
0.54%
jan 1, 1988
19.531
-1.691
-7.97%
jan 1, 1989
19.944
+0.413
2.11%
jan 1, 1990
20.674
+0.73
3.66%
jan 1, 1991
20.794
+0.121
0.58%
jan 1, 1992
19.05
-1.744
-8.39%
jan 1, 1993
20.827
+1.777
9.33%
jan 1, 1994
20.48
-0.347
-1.67%
jan 1, 1995
18.598
-1.882
-9.19%
jan 1, 1996
19.227
+0.63
3.39%
jan 1, 1997
21.192
+1.965
10.22%
jan 1, 1998
21.457
+0.265
1.25%
jan 1, 1999
19.787
-1.67
-7.78%
jan 1, 2000
18.399
-1.388
-7.02%
jan 1, 2001
18.113
-0.286
-1.55%
jan 1, 2002
17.756
-0.357
-1.97%
jan 1, 2003
19.161
+1.406
7.92%
jan 1, 2004
19.582
+0.42
2.19%
jan 1, 2005
23.922
+4.34
22.16%
jan 1, 2006
25.891
+1.969
8.23%
jan 1, 2007
24.804
-1.087
-4.2%
jan 1, 2008
25.461
+0.657
2.65%
jan 1, 2009
28.267
+2.806
11.02%
jan 1, 2010
29.61
+1.343
4.75%
jan 1, 2011
34.996
+5.386
18.19%
jan 1, 2012
36.092
+1.096
3.13%
jan 1, 2013
34.568
-1.524
-4.22%
jan 1, 2014
32.206
-2.363
-6.83%
Ranking of countries by current statistics by years


Comments: