29
/
en
AIzaSyAYiBZKx7MnpbEhh9jyipgxe19OcubqV5w
April 1, 2024
31379
Europe & Central Asia (excluding high income)
ECA
false
2
1
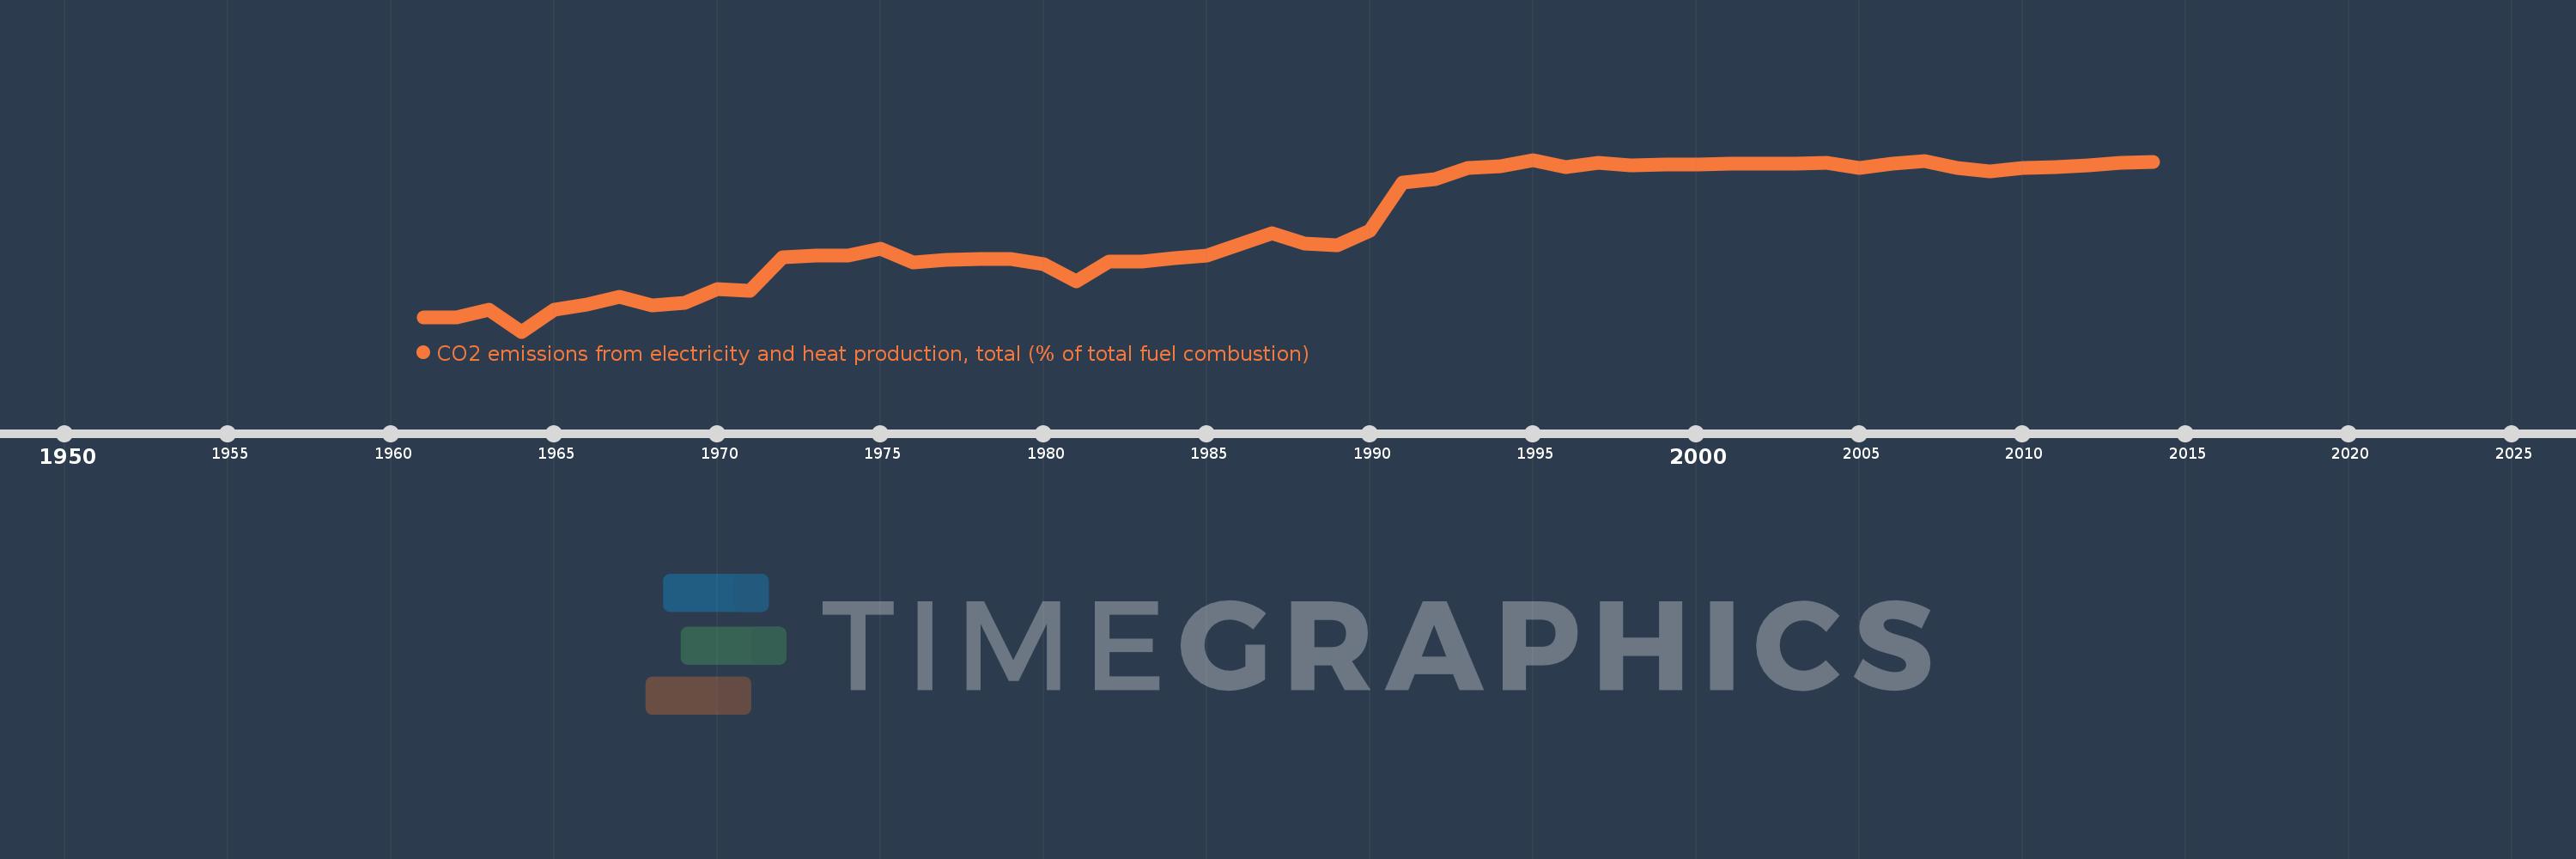
CO2 emissions from electricity and heat production, total (% of total fuel combustion)
2014,2013,2012,2011,2010,2009,2008,2007,2006,2005,2004,2003,2002,2001,2000,1999,1998,1997,1996,1995,1994,1993,1992,1991,1990,1989,1988,1987,1986,1985,1984,1983,1982,1981,1980,1979,1978,1977,1976,1975,1974,1973,1972,1971,1970,1969,1968,1967,1966,1965,1964,1963,1962,1961
This statistics in other country:
AlbaniaAlgeriaAngolaArab WorldArgentinaArmeniaAustraliaAustriaAzerbaijanBahrainBangladeshBelarusBelgiumBeninBoliviaBosnia and HerzegovinaBotswanaBrazilBrunei DarussalamBulgariaCambodiaCameroonCanadaCaribbean small statesCentral Europe and the BalticsChileChinaColombiaCongo, Dem. Rep.Congo, Rep.Costa RicaCote d'IvoireCroatiaCubaCuracaoCyprusCzech RepublicDenmarkDominican RepublicEarly-demographic dividendEast Asia & PacificEast Asia & Pacific (excluding high income)East Asia & Pacific (IDA & IBRD countries)EcuadorEgypt, Arab Rep.El SalvadorEritreaEstoniaEthiopiaEuro areaEurope & Central AsiaEurope & Central Asia (excluding high income)Europe & Central Asia (IDA & IBRD countries)European UnionFinlandFragile and conflict affected situationsFranceGabonGeorgiaGermanyGhanaGibraltarGreeceGuatemalaHaitiHeavily indebted poor countries (HIPC)High incomeHondurasHong Kong SAR, ChinaHungaryIBRD onlyIcelandIDA & IBRD totalIDA blendIDA onlyIDA totalIndiaIndonesiaIran, Islamic Rep.IraqIrelandIsraelItalyJamaicaJapanJordanKazakhstanKenyaKorea, Dem. People’s Rep.Korea, Rep.KosovoKuwaitKyrgyz RepublicLate-demographic dividendLatin America & Caribbean Latin America & Caribbean (excluding high income)Latin America & the Caribbean (IDA & IBRD countries)LatviaLeast developed countries: UN classificationLebanonLibyaLithuaniaLow & middle incomeLow incomeLower middle incomeLuxembourgMacedonia, FYRMalaysiaMaltaMauritiusMexicoMiddle East & North AfricaMiddle East & North Africa (excluding high income)Middle East & North Africa (IDA & IBRD countries)Middle incomeMoldovaMongoliaMontenegroMoroccoMozambiqueMyanmarNamibiaNepalNetherlandsNew ZealandNicaraguaNigerNigeriaNorth AmericaNorwayOECD membersOmanOther small statesPakistanPanamaParaguayPeruPhilippinesPolandPortugalPost-demographic dividendPre-demographic dividendQatarRomaniaRussian FederationSaudi ArabiaSenegalSerbiaSingaporeSlovak RepublicSloveniaSmall statesSouth AfricaSouth AsiaSouth Asia (IDA & IBRD)South SudanSpainSri LankaSub-Saharan Africa Sub-Saharan Africa (excluding high income)Sub-Saharan Africa (IDA & IBRD countries)SudanSwedenSwitzerlandSyrian Arab RepublicTajikistanTanzaniaThailandTogoTrinidad and TobagoTunisiaTurkeyTurkmenistanUkraineUnited Arab EmiratesUnited KingdomUnited StatesUpper middle incomeUruguayUzbekistanVenezuela, RBVietnamWorldYemen, Rep.ZambiaZimbabwe Timeline:
This timeline shows a graph from 1961 to 2014 of Europe & Central Asia (excluding high income). No data until 1960. Number of actual observations by date: 54.
Source name:
World Development Indicators
Source organization:
IEA Statistics © OECD/IEA 2014 (http://www.iea.org/stats/index.asp), subject to https://www.iea.org/t&c/termsandconditions/
Categories, topics:
Environment
Last updated:
apr 23, 2017
Indicators value changes by year
Minimum:
16.215
jan 1, 1964
Maximum:
58.633
jan 1, 1995
At the date of observation
Value
Absolute change
Change from previous value
jan 1, 1961
19.738
+19.738
0.0%
jan 1, 1962
19.683
-0.055
-0.28%
jan 1, 1963
21.641
+1.957
9.94%
jan 1, 1964
16.215
-5.426
-25.07%
jan 1, 1965
21.673
+5.458
33.66%
jan 1, 1966
22.82
+1.147
5.29%
jan 1, 1967
24.844
+2.024
8.87%
jan 1, 1968
22.718
-2.126
-8.56%
jan 1, 1969
23.267
+0.549
2.42%
jan 1, 1970
26.796
+3.528
15.16%
jan 1, 1971
26.294
-0.502
-1.87%
jan 1, 1972
34.559
+8.265
31.44%
jan 1, 1973
34.897
+0.338
0.98%
jan 1, 1974
35.026
+0.129
0.37%
jan 1, 1975
36.578
+1.552
4.43%
jan 1, 1976
33.218
-3.36
-9.19%
jan 1, 1977
33.829
+0.611
1.84%
jan 1, 1978
34.096
+0.267
0.79%
jan 1, 1979
34.23
+0.134
0.39%
jan 1, 1980
32.902
-1.328
-3.88%
jan 1, 1981
28.518
-4.384
-13.32%
jan 1, 1982
33.581
+5.063
17.75%
jan 1, 1983
33.582
+0.001
0.0%
jan 1, 1984
34.259
+0.677
2.02%
jan 1, 1985
34.957
+0.698
2.04%
jan 1, 1986
37.79
+2.834
8.11%
jan 1, 1987
40.522
+2.732
7.23%
jan 1, 1988
37.987
-2.535
-6.25%
jan 1, 1989
37.478
-0.51
-1.34%
jan 1, 1990
41.182
+3.704
9.88%
jan 1, 1991
53.007
+11.825
28.71%
jan 1, 1992
53.756
+0.749
1.41%
jan 1, 1993
56.551
+2.795
5.2%
jan 1, 1994
57.001
+0.451
0.8%
jan 1, 1995
58.633
+1.632
2.86%
jan 1, 1996
56.82
-1.813
-3.09%
jan 1, 1997
57.88
+1.06
1.86%
jan 1, 1998
57.313
-0.566
-0.98%
jan 1, 1999
57.523
+0.209
0.36%
jan 1, 2000
57.445
-0.078
-0.14%
jan 1, 2001
57.599
+0.154
0.27%
jan 1, 2002
57.698
+0.099
0.17%
jan 1, 2003
57.73
+0.032
0.06%
jan 1, 2004
57.826
+0.097
0.17%
jan 1, 2005
56.684
-1.142
-1.97%
jan 1, 2006
57.662
+0.978
1.72%
jan 1, 2007
58.246
+0.583
1.01%
jan 1, 2008
56.554
-1.691
-2.9%
jan 1, 2009
55.757
-0.798
-1.41%
jan 1, 2010
56.623
+0.867
1.55%
jan 1, 2011
56.906
+0.283
0.5%
jan 1, 2012
57.162
+0.256
0.45%
jan 1, 2013
57.802
+0.64
1.12%
jan 1, 2014
58.131
+0.329
0.57%
Ranking of countries by current statistics by years


Comments: