29
/
en
AIzaSyAYiBZKx7MnpbEhh9jyipgxe19OcubqV5w
April 1, 2024
25548
Central Europe and the Baltics
CEB
false
2
1
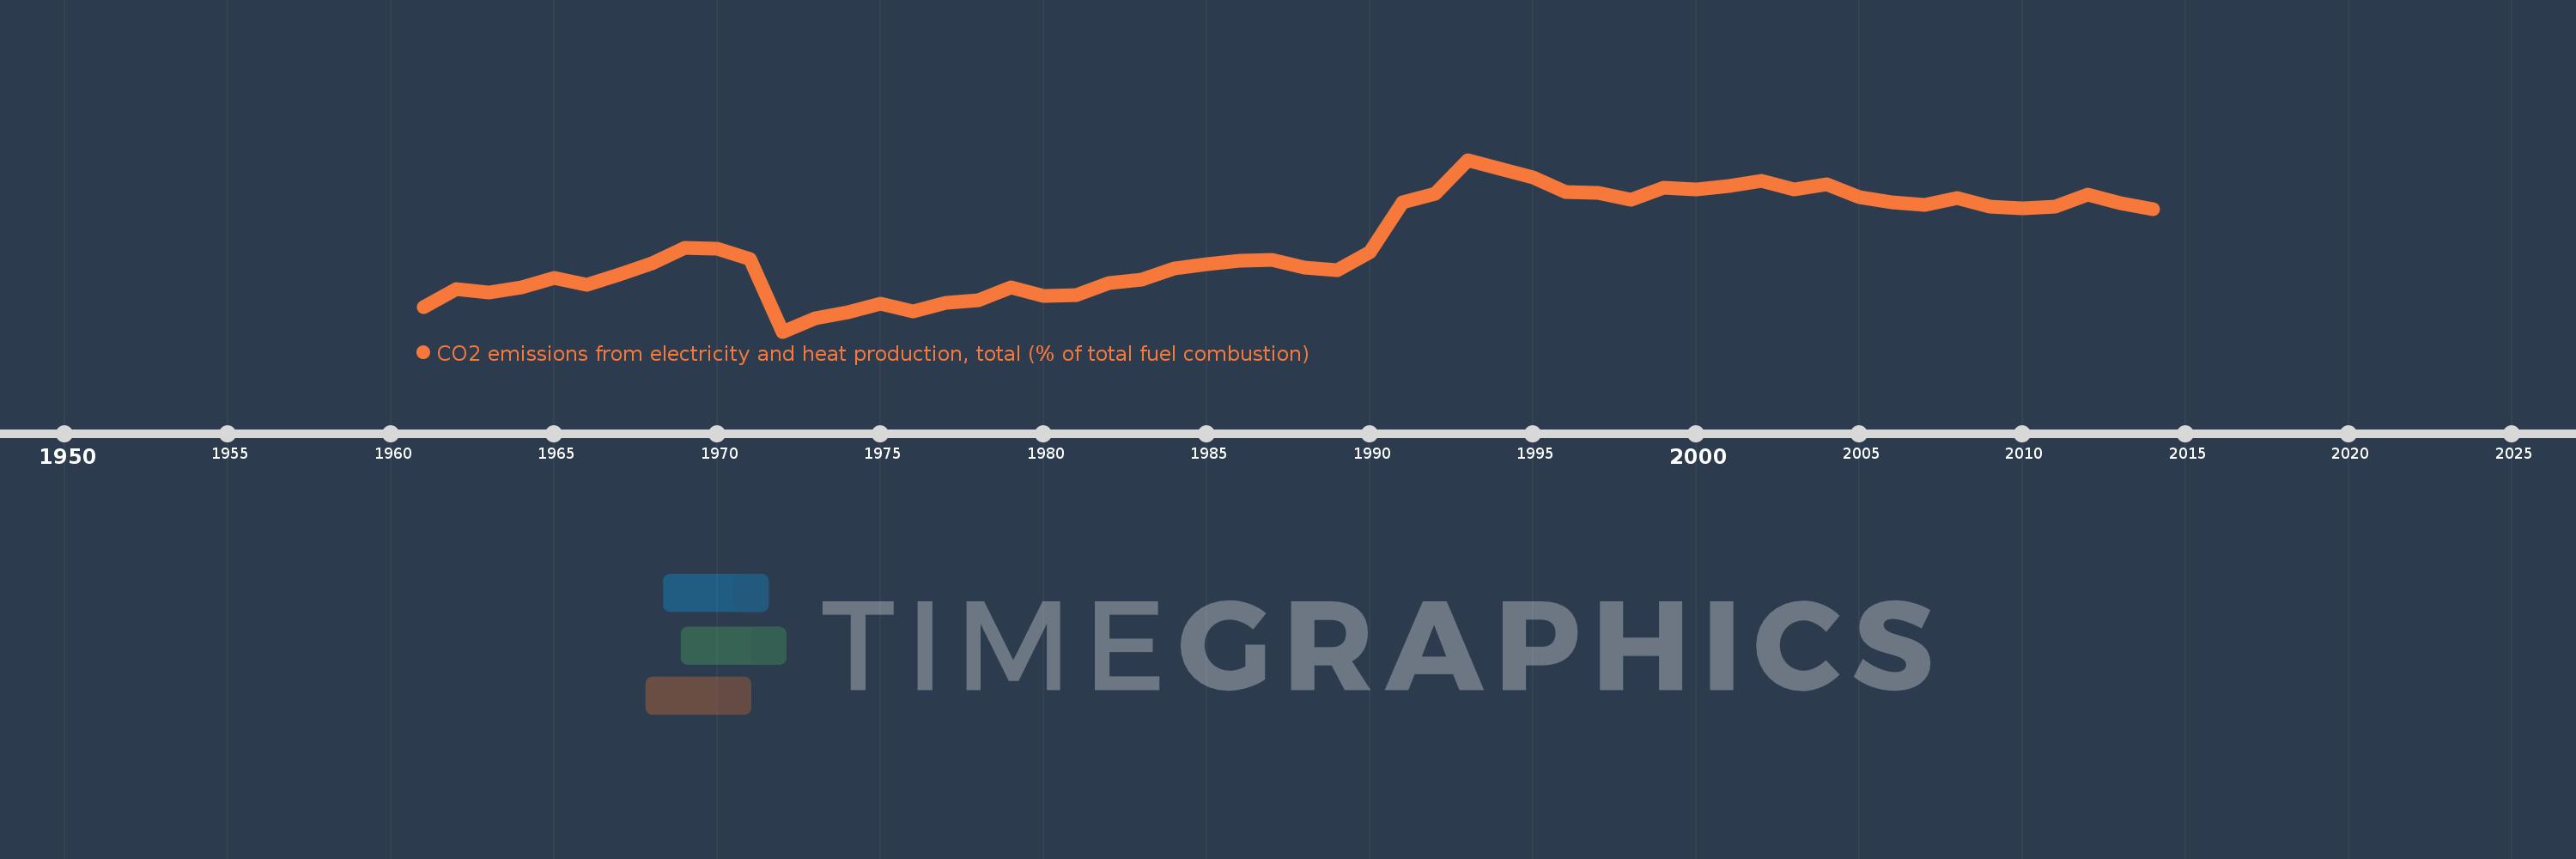
CO2 emissions from electricity and heat production, total (% of total fuel combustion)
2014,2013,2012,2011,2010,2009,2008,2007,2006,2005,2004,2003,2002,2001,2000,1999,1998,1997,1996,1995,1994,1993,1992,1991,1990,1989,1988,1987,1986,1985,1984,1983,1982,1981,1980,1979,1978,1977,1976,1975,1974,1973,1972,1971,1970,1969,1968,1967,1966,1965,1964,1963,1962,1961
This statistics in other country:
AlbaniaAlgeriaAngolaArab WorldArgentinaArmeniaAustraliaAustriaAzerbaijanBahrainBangladeshBelarusBelgiumBeninBoliviaBosnia and HerzegovinaBotswanaBrazilBrunei DarussalamBulgariaCambodiaCameroonCanadaCaribbean small statesCentral Europe and the BalticsChileChinaColombiaCongo, Dem. Rep.Congo, Rep.Costa RicaCote d'IvoireCroatiaCubaCuracaoCyprusCzech RepublicDenmarkDominican RepublicEarly-demographic dividendEast Asia & PacificEast Asia & Pacific (excluding high income)East Asia & Pacific (IDA & IBRD countries)EcuadorEgypt, Arab Rep.El SalvadorEritreaEstoniaEthiopiaEuro areaEurope & Central AsiaEurope & Central Asia (excluding high income)Europe & Central Asia (IDA & IBRD countries)European UnionFinlandFragile and conflict affected situationsFranceGabonGeorgiaGermanyGhanaGibraltarGreeceGuatemalaHaitiHeavily indebted poor countries (HIPC)High incomeHondurasHong Kong SAR, ChinaHungaryIBRD onlyIcelandIDA & IBRD totalIDA blendIDA onlyIDA totalIndiaIndonesiaIran, Islamic Rep.IraqIrelandIsraelItalyJamaicaJapanJordanKazakhstanKenyaKorea, Dem. People’s Rep.Korea, Rep.KosovoKuwaitKyrgyz RepublicLate-demographic dividendLatin America & Caribbean Latin America & Caribbean (excluding high income)Latin America & the Caribbean (IDA & IBRD countries)LatviaLeast developed countries: UN classificationLebanonLibyaLithuaniaLow & middle incomeLow incomeLower middle incomeLuxembourgMacedonia, FYRMalaysiaMaltaMauritiusMexicoMiddle East & North AfricaMiddle East & North Africa (excluding high income)Middle East & North Africa (IDA & IBRD countries)Middle incomeMoldovaMongoliaMontenegroMoroccoMozambiqueMyanmarNamibiaNepalNetherlandsNew ZealandNicaraguaNigerNigeriaNorth AmericaNorwayOECD membersOmanOther small statesPakistanPanamaParaguayPeruPhilippinesPolandPortugalPost-demographic dividendPre-demographic dividendQatarRomaniaRussian FederationSaudi ArabiaSenegalSerbiaSingaporeSlovak RepublicSloveniaSmall statesSouth AfricaSouth AsiaSouth Asia (IDA & IBRD)South SudanSpainSri LankaSub-Saharan Africa Sub-Saharan Africa (excluding high income)Sub-Saharan Africa (IDA & IBRD countries)SudanSwedenSwitzerlandSyrian Arab RepublicTajikistanTanzaniaThailandTogoTrinidad and TobagoTunisiaTurkeyTurkmenistanUkraineUnited Arab EmiratesUnited KingdomUnited StatesUpper middle incomeUruguayUzbekistanVenezuela, RBVietnamWorldYemen, Rep.ZambiaZimbabwe Timeline:
This timeline shows a graph from 1961 to 2014 of Central Europe and the Baltics. No data until 1960. Number of actual observations by date: 54.
Source name:
World Development Indicators
Source organization:
IEA Statistics © OECD/IEA 2014 (http://www.iea.org/stats/index.asp), subject to https://www.iea.org/t&c/termsandconditions/
Categories, topics:
Environment
Last updated:
apr 23, 2017
Indicators value changes by year
Maximum:
58.845
jan 1, 1993
At the date of observation
Value
Absolute change
Change from previous value
jan 1, 1961
42.272
+42.272
0.0%
jan 1, 1962
44.388
+2.116
5.0%
jan 1, 1963
43.937
-0.451
-1.02%
jan 1, 1964
44.539
+0.603
1.37%
jan 1, 1965
45.552
+1.013
2.27%
jan 1, 1966
44.87
-0.682
-1.5%
jan 1, 1967
45.986
+1.116
2.49%
jan 1, 1968
47.211
+1.225
2.66%
jan 1, 1969
48.938
+1.727
3.66%
jan 1, 1970
48.844
-0.094
-0.19%
jan 1, 1971
47.721
-1.123
-2.3%
jan 1, 1972
39.57
-8.151
-17.08%
jan 1, 1973
41.039
+1.468
3.71%
jan 1, 1974
41.692
+0.653
1.59%
jan 1, 1975
42.741
+1.049
2.52%
jan 1, 1976
41.87
-0.871
-2.04%
jan 1, 1977
42.754
+0.884
2.11%
jan 1, 1978
43.115
+0.361
0.84%
jan 1, 1979
44.547
+1.433
3.32%
jan 1, 1980
43.532
-1.015
-2.28%
jan 1, 1981
43.694
+0.163
0.37%
jan 1, 1982
45.017
+1.322
3.03%
jan 1, 1983
45.379
+0.362
0.8%
jan 1, 1984
46.638
+1.259
2.77%
jan 1, 1985
47.107
+0.469
1.01%
jan 1, 1986
47.55
+0.443
0.94%
jan 1, 1987
47.65
+0.1
0.21%
jan 1, 1988
46.739
-0.911
-1.91%
jan 1, 1989
46.439
-0.3
-0.64%
jan 1, 1990
48.492
+2.054
4.42%
jan 1, 1991
54.111
+5.619
11.59%
jan 1, 1992
55.027
+0.916
1.69%
jan 1, 1993
58.845
+3.818
6.94%
jan 1, 1994
57.846
-0.999
-1.7%
jan 1, 1995
56.869
-0.978
-1.69%
jan 1, 1996
55.226
-1.643
-2.89%
jan 1, 1997
55.092
-0.134
-0.24%
jan 1, 1998
54.403
-0.689
-1.25%
jan 1, 1999
55.669
+1.266
2.33%
jan 1, 2000
55.534
-0.135
-0.24%
jan 1, 2001
55.951
+0.418
0.75%
jan 1, 2002
56.437
+0.486
0.87%
jan 1, 2003
55.48
-0.957
-1.7%
jan 1, 2004
56.071
+0.591
1.07%
jan 1, 2005
54.661
-1.41
-2.51%
jan 1, 2006
54.034
-0.627
-1.15%
jan 1, 2007
53.771
-0.263
-0.49%
jan 1, 2008
54.563
+0.792
1.47%
jan 1, 2009
53.636
-0.928
-1.7%
jan 1, 2010
53.389
-0.246
-0.46%
jan 1, 2011
53.618
+0.229
0.43%
jan 1, 2012
54.927
+1.309
2.44%
jan 1, 2013
54.001
-0.926
-1.69%
jan 1, 2014
53.343
-0.658
-1.22%
Ranking of countries by current statistics by years


Comments: