29
/
en
AIzaSyAYiBZKx7MnpbEhh9jyipgxe19OcubqV5w
April 1, 2024
169708
Korea, Rep.
KOR
true
2
1
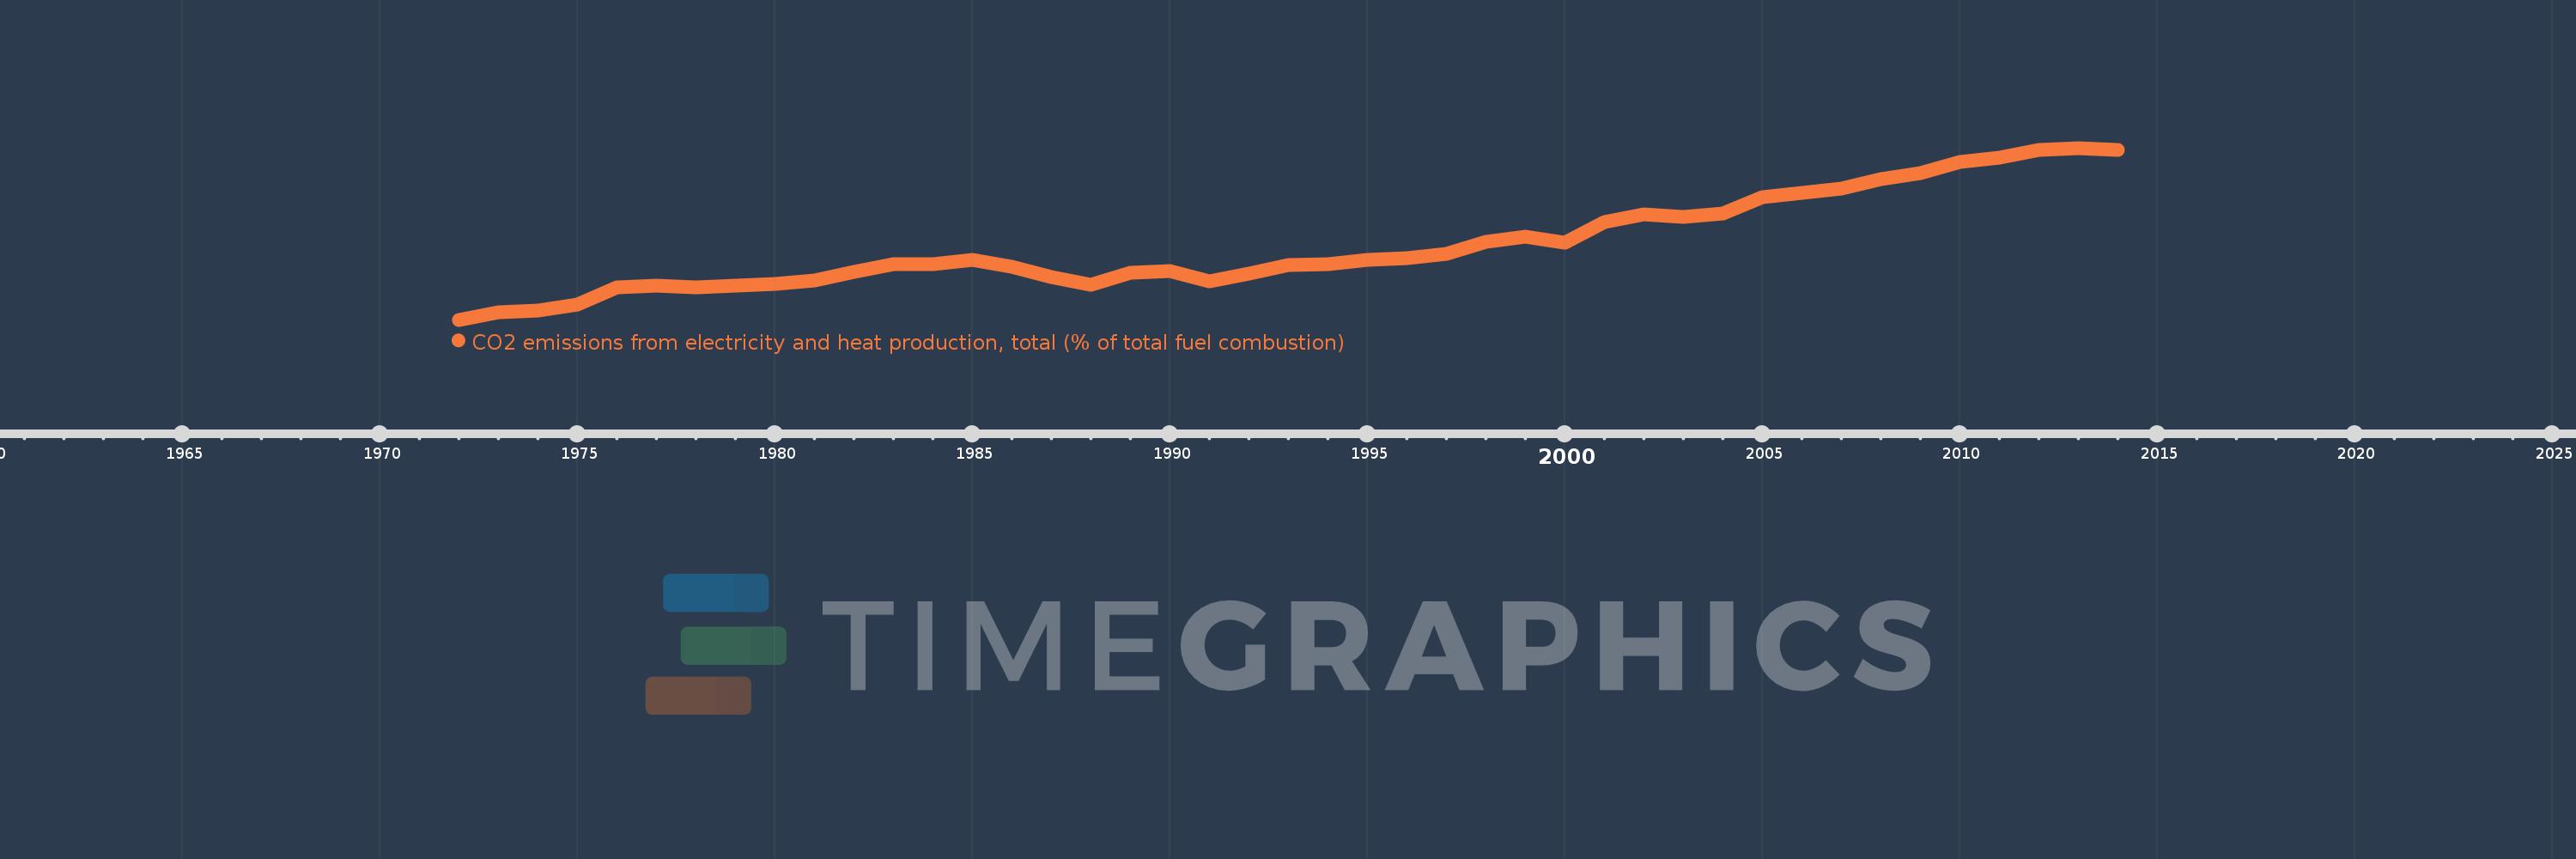
CO2 emissions from electricity and heat production, total (% of total fuel combustion)
2014,2013,2012,2011,2010,2009,2008,2007,2006,2005,2004,2003,2002,2001,2000,1999,1998,1997,1996,1995,1994,1993,1992,1991,1990,1989,1988,1987,1986,1985,1984,1983,1982,1981,1980,1979,1978,1977,1976,1975,1974,1973,1972
This statistics in other country:
AlbaniaAlgeriaAngolaArab WorldArgentinaArmeniaAustraliaAustriaAzerbaijanBahrainBangladeshBelarusBelgiumBeninBoliviaBosnia and HerzegovinaBotswanaBrazilBrunei DarussalamBulgariaCambodiaCameroonCanadaCaribbean small statesCentral Europe and the BalticsChileChinaColombiaCongo, Dem. Rep.Congo, Rep.Costa RicaCote d'IvoireCroatiaCubaCuracaoCyprusCzech RepublicDenmarkDominican RepublicEarly-demographic dividendEast Asia & PacificEast Asia & Pacific (excluding high income)East Asia & Pacific (IDA & IBRD countries)EcuadorEgypt, Arab Rep.El SalvadorEritreaEstoniaEthiopiaEuro areaEurope & Central AsiaEurope & Central Asia (excluding high income)Europe & Central Asia (IDA & IBRD countries)European UnionFinlandFragile and conflict affected situationsFranceGabonGeorgiaGermanyGhanaGibraltarGreeceGuatemalaHaitiHeavily indebted poor countries (HIPC)High incomeHondurasHong Kong SAR, ChinaHungaryIBRD onlyIcelandIDA & IBRD totalIDA blendIDA onlyIDA totalIndiaIndonesiaIran, Islamic Rep.IraqIrelandIsraelItalyJamaicaJapanJordanKazakhstanKenyaKorea, Dem. People’s Rep.Korea, Rep.KosovoKuwaitKyrgyz RepublicLate-demographic dividendLatin America & Caribbean Latin America & Caribbean (excluding high income)Latin America & the Caribbean (IDA & IBRD countries)LatviaLeast developed countries: UN classificationLebanonLibyaLithuaniaLow & middle incomeLow incomeLower middle incomeLuxembourgMacedonia, FYRMalaysiaMaltaMauritiusMexicoMiddle East & North AfricaMiddle East & North Africa (excluding high income)Middle East & North Africa (IDA & IBRD countries)Middle incomeMoldovaMongoliaMontenegroMoroccoMozambiqueMyanmarNamibiaNepalNetherlandsNew ZealandNicaraguaNigerNigeriaNorth AmericaNorwayOECD membersOmanOther small statesPakistanPanamaParaguayPeruPhilippinesPolandPortugalPost-demographic dividendPre-demographic dividendQatarRomaniaRussian FederationSaudi ArabiaSenegalSerbiaSingaporeSlovak RepublicSloveniaSmall statesSouth AfricaSouth AsiaSouth Asia (IDA & IBRD)South SudanSpainSri LankaSub-Saharan Africa Sub-Saharan Africa (excluding high income)Sub-Saharan Africa (IDA & IBRD countries)SudanSwedenSwitzerlandSyrian Arab RepublicTajikistanTanzaniaThailandTogoTrinidad and TobagoTunisiaTurkeyTurkmenistanUkraineUnited Arab EmiratesUnited KingdomUnited StatesUpper middle incomeUruguayUzbekistanVenezuela, RBVietnamWorldYemen, Rep.ZambiaZimbabwe Timeline:
This timeline shows a graph from 1972 to 2014 of Korea, Rep.. No data until 1971. Number of actual observations by date: 43.
Source name:
World Development Indicators
Source organization:
IEA Statistics © OECD/IEA 2014 (http://www.iea.org/stats/index.asp), subject to https://www.iea.org/t&c/termsandconditions/
Categories, topics:
Environment
Last updated:
apr 23, 2017
Indicators value changes by year
Minimum:
18.512
jan 1, 1972
Maximum:
60.957
jan 1, 2013
At the date of observation
Value
Absolute change
Change from previous value
jan 1, 1972
18.512
+18.512
0.0%
jan 1, 1973
20.419
+1.908
10.31%
jan 1, 1974
20.724
+0.305
1.49%
jan 1, 1975
22.204
+1.48
7.14%
jan 1, 1976
26.583
+4.379
19.72%
jan 1, 1977
26.878
+0.296
1.11%
jan 1, 1978
26.508
-0.37
-1.38%
jan 1, 1979
26.983
+0.475
1.79%
jan 1, 1980
27.378
+0.394
1.46%
jan 1, 1981
28.176
+0.798
2.91%
jan 1, 1982
30.364
+2.188
7.77%
jan 1, 1983
32.269
+1.905
6.27%
jan 1, 1984
32.281
+0.013
0.04%
jan 1, 1985
33.217
+0.935
2.9%
jan 1, 1986
31.614
-1.603
-4.82%
jan 1, 1987
29.164
-2.45
-7.75%
jan 1, 1988
27.064
-2.1
-7.2%
jan 1, 1989
30.148
+3.084
11.39%
jan 1, 1990
30.47
+0.322
1.07%
jan 1, 1991
27.983
-2.487
-8.16%
jan 1, 1992
29.841
+1.858
6.64%
jan 1, 1993
31.934
+2.092
7.01%
jan 1, 1994
32.148
+0.214
0.67%
jan 1, 1995
33.231
+1.084
3.37%
jan 1, 1996
33.723
+0.492
1.48%
jan 1, 1997
34.86
+1.136
3.37%
jan 1, 1998
37.724
+2.864
8.22%
jan 1, 1999
39.097
+1.373
3.64%
jan 1, 2000
37.641
-1.456
-3.72%
jan 1, 2001
42.593
+4.952
13.16%
jan 1, 2002
44.64
+2.046
4.8%
jan 1, 2003
43.867
-0.773
-1.73%
jan 1, 2004
44.772
+0.905
2.06%
jan 1, 2005
48.733
+3.961
8.85%
jan 1, 2006
49.949
+1.216
2.5%
jan 1, 2007
50.927
+0.978
1.96%
jan 1, 2008
53.245
+2.318
4.55%
jan 1, 2009
54.835
+1.591
2.99%
jan 1, 2010
57.498
+2.663
4.86%
jan 1, 2011
58.611
+1.113
1.94%
jan 1, 2012
60.41
+1.799
3.07%
jan 1, 2013
60.957
+0.547
0.91%
jan 1, 2014
60.444
-0.514
-0.84%
Ranking of countries by current statistics by years


Comments: