29
/
en
AIzaSyAYiBZKx7MnpbEhh9jyipgxe19OcubqV5w
April 1, 2024
40545
Late-demographic dividend
LTE
false
2
1
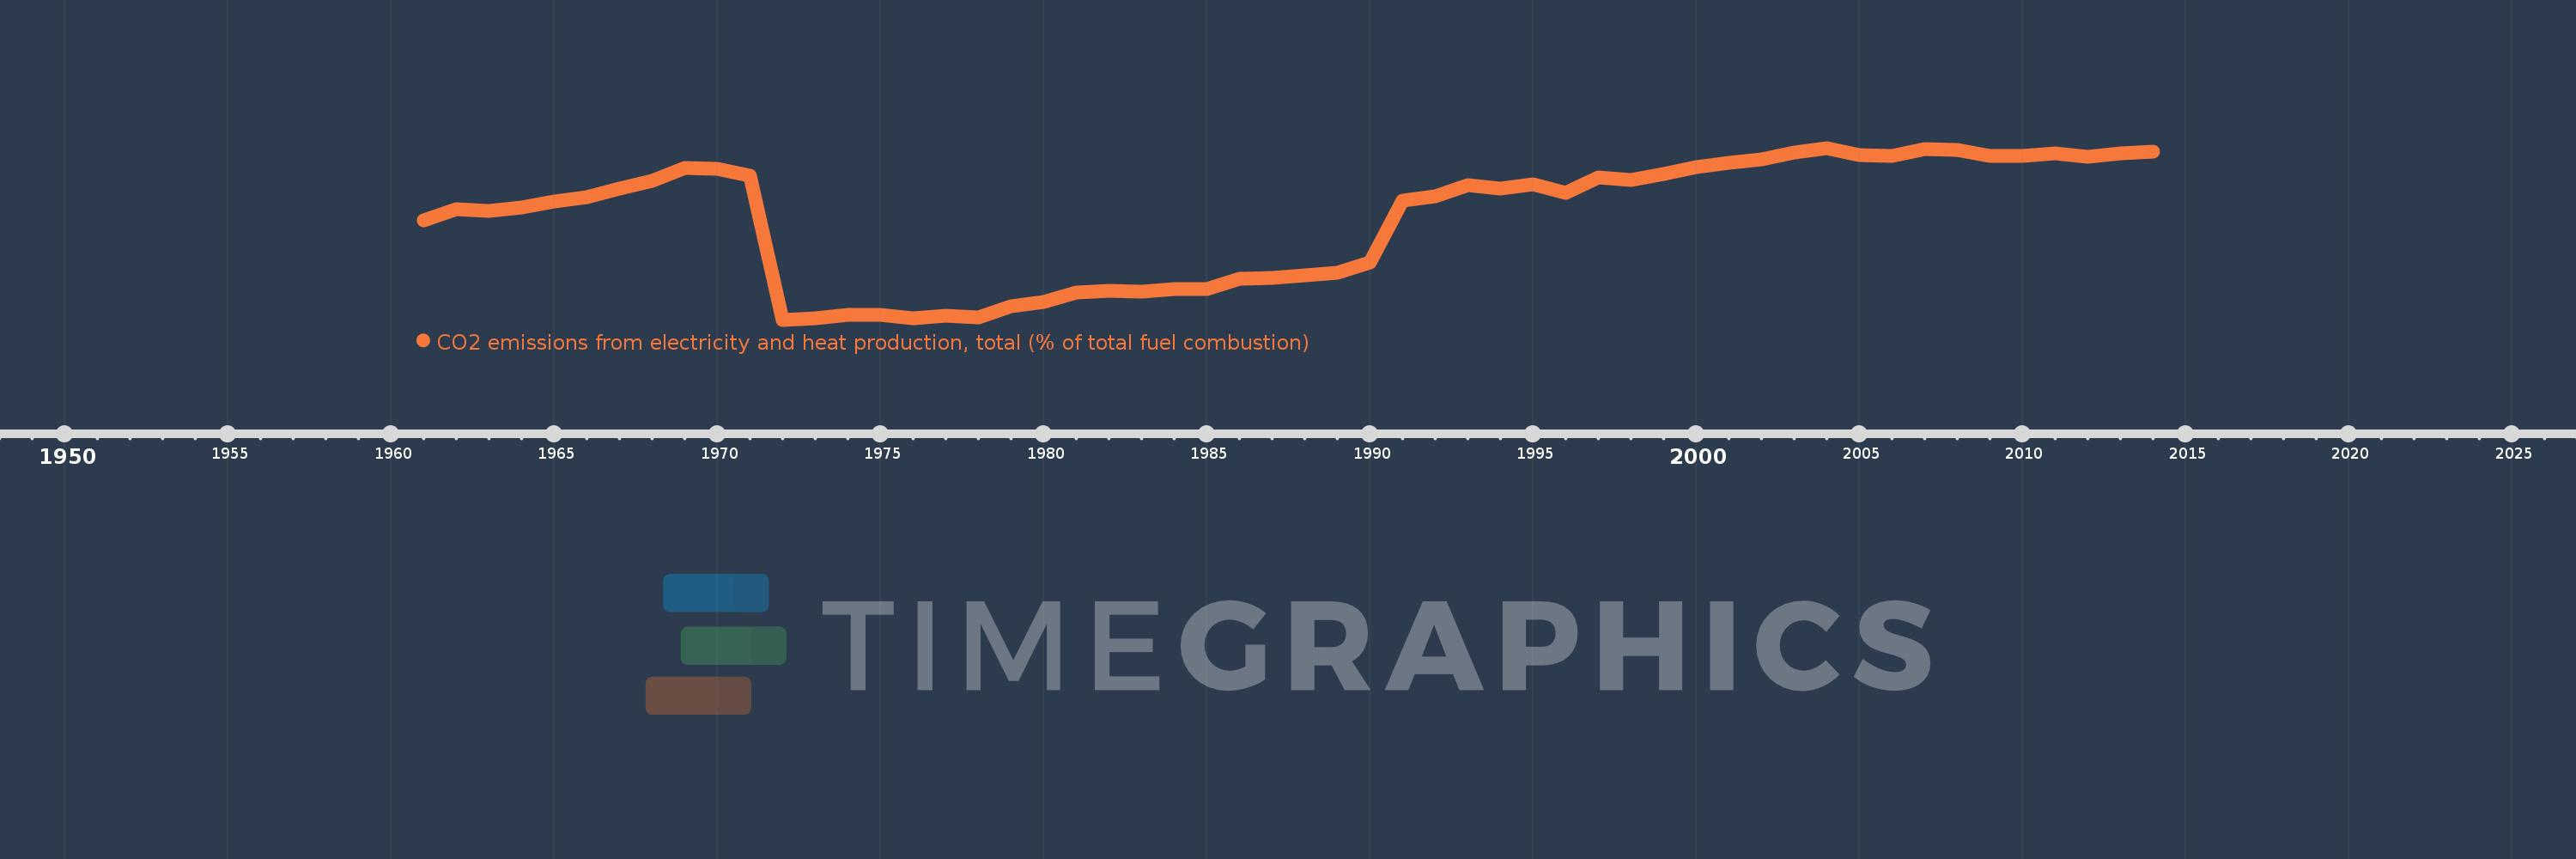
CO2 emissions from electricity and heat production, total (% of total fuel combustion)
2014,2013,2012,2011,2010,2009,2008,2007,2006,2005,2004,2003,2002,2001,2000,1999,1998,1997,1996,1995,1994,1993,1992,1991,1990,1989,1988,1987,1986,1985,1984,1983,1982,1981,1980,1979,1978,1977,1976,1975,1974,1973,1972,1971,1970,1969,1968,1967,1966,1965,1964,1963,1962,1961
This statistics in other country:
AlbaniaAlgeriaAngolaArab WorldArgentinaArmeniaAustraliaAustriaAzerbaijanBahrainBangladeshBelarusBelgiumBeninBoliviaBosnia and HerzegovinaBotswanaBrazilBrunei DarussalamBulgariaCambodiaCameroonCanadaCaribbean small statesCentral Europe and the BalticsChileChinaColombiaCongo, Dem. Rep.Congo, Rep.Costa RicaCote d'IvoireCroatiaCubaCuracaoCyprusCzech RepublicDenmarkDominican RepublicEarly-demographic dividendEast Asia & PacificEast Asia & Pacific (excluding high income)East Asia & Pacific (IDA & IBRD countries)EcuadorEgypt, Arab Rep.El SalvadorEritreaEstoniaEthiopiaEuro areaEurope & Central AsiaEurope & Central Asia (excluding high income)Europe & Central Asia (IDA & IBRD countries)European UnionFinlandFragile and conflict affected situationsFranceGabonGeorgiaGermanyGhanaGibraltarGreeceGuatemalaHaitiHeavily indebted poor countries (HIPC)High incomeHondurasHong Kong SAR, ChinaHungaryIBRD onlyIcelandIDA & IBRD totalIDA blendIDA onlyIDA totalIndiaIndonesiaIran, Islamic Rep.IraqIrelandIsraelItalyJamaicaJapanJordanKazakhstanKenyaKorea, Dem. People’s Rep.Korea, Rep.KosovoKuwaitKyrgyz RepublicLate-demographic dividendLatin America & Caribbean Latin America & Caribbean (excluding high income)Latin America & the Caribbean (IDA & IBRD countries)LatviaLeast developed countries: UN classificationLebanonLibyaLithuaniaLow & middle incomeLow incomeLower middle incomeLuxembourgMacedonia, FYRMalaysiaMaltaMauritiusMexicoMiddle East & North AfricaMiddle East & North Africa (excluding high income)Middle East & North Africa (IDA & IBRD countries)Middle incomeMoldovaMongoliaMontenegroMoroccoMozambiqueMyanmarNamibiaNepalNetherlandsNew ZealandNicaraguaNigerNigeriaNorth AmericaNorwayOECD membersOmanOther small statesPakistanPanamaParaguayPeruPhilippinesPolandPortugalPost-demographic dividendPre-demographic dividendQatarRomaniaRussian FederationSaudi ArabiaSenegalSerbiaSingaporeSlovak RepublicSloveniaSmall statesSouth AfricaSouth AsiaSouth Asia (IDA & IBRD)South SudanSpainSri LankaSub-Saharan Africa Sub-Saharan Africa (excluding high income)Sub-Saharan Africa (IDA & IBRD countries)SudanSwedenSwitzerlandSyrian Arab RepublicTajikistanTanzaniaThailandTogoTrinidad and TobagoTunisiaTurkeyTurkmenistanUkraineUnited Arab EmiratesUnited KingdomUnited StatesUpper middle incomeUruguayUzbekistanVenezuela, RBVietnamWorldYemen, Rep.ZambiaZimbabwe Timeline:
This timeline shows a graph from 1961 to 2014 of Late-demographic dividend. No data until 1960. Number of actual observations by date: 54.
Source name:
World Development Indicators
Source organization:
IEA Statistics © OECD/IEA 2014 (http://www.iea.org/stats/index.asp), subject to https://www.iea.org/t&c/termsandconditions/
Categories, topics:
Environment
Last updated:
apr 23, 2017
Indicators value changes by year
Minimum:
25.253
jan 1, 1972
Maximum:
53.187
jan 1, 2004
At the date of observation
Value
Absolute change
Change from previous value
jan 1, 1961
41.437
+41.437
0.0%
jan 1, 1962
43.181
+1.744
4.21%
jan 1, 1963
42.91
-0.271
-0.63%
jan 1, 1964
43.496
+0.586
1.37%
jan 1, 1965
44.437
+0.942
2.16%
jan 1, 1966
45.182
+0.745
1.68%
jan 1, 1967
46.58
+1.398
3.09%
jan 1, 1968
47.861
+1.281
2.75%
jan 1, 1969
49.907
+2.045
4.27%
jan 1, 1970
49.786
-0.121
-0.24%
jan 1, 1971
48.719
-1.067
-2.14%
jan 1, 1972
25.253
-23.467
-48.17%
jan 1, 1973
25.537
+0.284
1.13%
jan 1, 1974
26.068
+0.53
2.08%
jan 1, 1975
26.101
+0.033
0.13%
jan 1, 1976
25.43
-0.671
-2.57%
jan 1, 1977
25.877
+0.446
1.75%
jan 1, 1978
25.675
-0.202
-0.78%
jan 1, 1979
27.478
+1.803
7.02%
jan 1, 1980
28.126
+0.648
2.36%
jan 1, 1981
29.682
+1.556
5.53%
jan 1, 1982
30.008
+0.326
1.1%
jan 1, 1983
29.81
-0.198
-0.66%
jan 1, 1984
30.205
+0.395
1.32%
jan 1, 1985
30.242
+0.037
0.12%
jan 1, 1986
31.863
+1.62
5.36%
jan 1, 1987
32.105
+0.243
0.76%
jan 1, 1988
32.452
+0.346
1.08%
jan 1, 1989
32.926
+0.474
1.46%
jan 1, 1990
34.564
+1.638
4.97%
jan 1, 1991
44.601
+10.038
29.04%
jan 1, 1992
45.353
+0.751
1.68%
jan 1, 1993
47.082
+1.729
3.81%
jan 1, 1994
46.531
-0.551
-1.17%
jan 1, 1995
47.234
+0.703
1.51%
jan 1, 1996
45.827
-1.407
-2.98%
jan 1, 1997
48.439
+2.612
5.7%
jan 1, 1998
47.92
-0.519
-1.07%
jan 1, 1999
48.946
+1.026
2.14%
jan 1, 2000
50.015
+1.069
2.18%
jan 1, 2001
50.768
+0.753
1.5%
jan 1, 2002
51.295
+0.528
1.04%
jan 1, 2003
52.501
+1.206
2.35%
jan 1, 2004
53.187
+0.686
1.31%
jan 1, 2005
52.054
-1.134
-2.13%
jan 1, 2006
51.946
-0.108
-0.21%
jan 1, 2007
52.96
+1.013
1.95%
jan 1, 2008
52.887
-0.073
-0.14%
jan 1, 2009
51.842
-1.045
-1.98%
jan 1, 2010
51.955
+0.113
0.22%
jan 1, 2011
52.343
+0.388
0.75%
jan 1, 2012
51.717
-0.626
-1.2%
jan 1, 2013
52.265
+0.548
1.06%
jan 1, 2014
52.605
+0.339
0.65%
Ranking of countries by current statistics by years


Comments: