29
/
en
AIzaSyAYiBZKx7MnpbEhh9jyipgxe19OcubqV5w
April 1, 2024
39763
IDA total
IDA
false
2
1
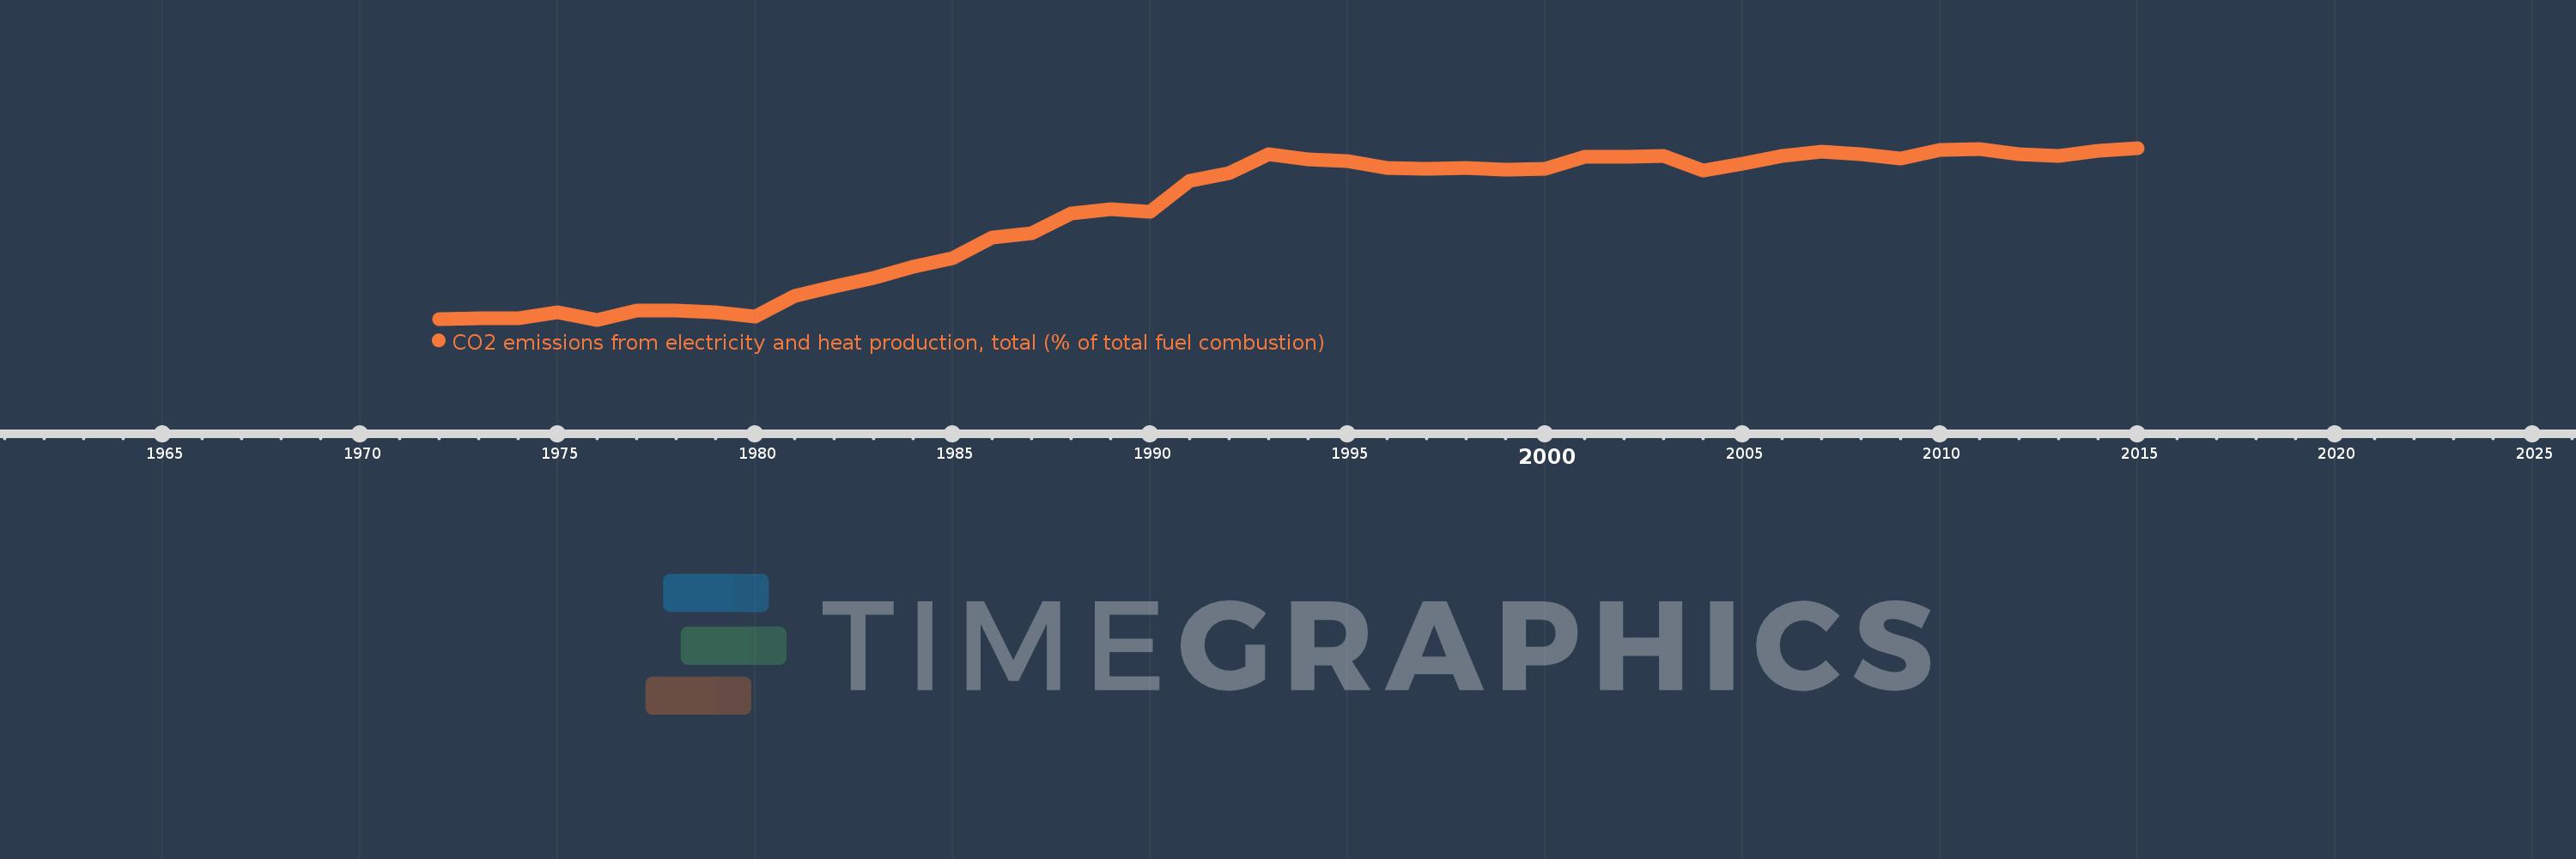
CO2 emissions from electricity and heat production, total (% of total fuel combustion)
2015,2014,2013,2012,2011,2010,2009,2008,2007,2006,2005,2004,2003,2002,2001,2000,1999,1998,1997,1996,1995,1994,1993,1992,1991,1990,1989,1988,1987,1986,1985,1984,1983,1982,1981,1980,1979,1978,1977,1976,1975,1974,1973,1972
This statistics in other country:
AlbaniaAlgeriaAngolaArab WorldArgentinaArmeniaAustraliaAustriaAzerbaijanBahrainBangladeshBelarusBelgiumBeninBoliviaBosnia and HerzegovinaBotswanaBrazilBrunei DarussalamBulgariaCambodiaCameroonCanadaCaribbean small statesCentral Europe and the BalticsChileChinaColombiaCongo, Dem. Rep.Congo, Rep.Costa RicaCote d'IvoireCroatiaCubaCuracaoCyprusCzech RepublicDenmarkDominican RepublicEarly-demographic dividendEast Asia & PacificEast Asia & Pacific (excluding high income)East Asia & Pacific (IDA & IBRD countries)EcuadorEgypt, Arab Rep.El SalvadorEritreaEstoniaEthiopiaEuro areaEurope & Central AsiaEurope & Central Asia (excluding high income)Europe & Central Asia (IDA & IBRD countries)European UnionFinlandFragile and conflict affected situationsFranceGabonGeorgiaGermanyGhanaGibraltarGreeceGuatemalaHaitiHeavily indebted poor countries (HIPC)High incomeHondurasHong Kong SAR, ChinaHungaryIBRD onlyIcelandIDA & IBRD totalIDA blendIDA onlyIDA totalIndiaIndonesiaIran, Islamic Rep.IraqIrelandIsraelItalyJamaicaJapanJordanKazakhstanKenyaKorea, Dem. People’s Rep.Korea, Rep.KosovoKuwaitKyrgyz RepublicLate-demographic dividendLatin America & Caribbean Latin America & Caribbean (excluding high income)Latin America & the Caribbean (IDA & IBRD countries)LatviaLeast developed countries: UN classificationLebanonLibyaLithuaniaLow & middle incomeLow incomeLower middle incomeLuxembourgMacedonia, FYRMalaysiaMaltaMauritiusMexicoMiddle East & North AfricaMiddle East & North Africa (excluding high income)Middle East & North Africa (IDA & IBRD countries)Middle incomeMoldovaMongoliaMontenegroMoroccoMozambiqueMyanmarNamibiaNepalNetherlandsNew ZealandNicaraguaNigerNigeriaNorth AmericaNorwayOECD membersOmanOther small statesPakistanPanamaParaguayPeruPhilippinesPolandPortugalPost-demographic dividendPre-demographic dividendQatarRomaniaRussian FederationSaudi ArabiaSenegalSerbiaSingaporeSlovak RepublicSloveniaSmall statesSouth AfricaSouth AsiaSouth Asia (IDA & IBRD)South SudanSpainSri LankaSub-Saharan Africa Sub-Saharan Africa (excluding high income)Sub-Saharan Africa (IDA & IBRD countries)SudanSwedenSwitzerlandSyrian Arab RepublicTajikistanTanzaniaThailandTogoTrinidad and TobagoTunisiaTurkeyTurkmenistanUkraineUnited Arab EmiratesUnited KingdomUnited StatesUpper middle incomeUruguayUzbekistanVenezuela, RBVietnamWorldYemen, Rep.ZambiaZimbabwe Timeline:
This timeline shows a graph from 1972 to 2015 of IDA total. No data until 1971. Number of actual observations by date: 44.
Source name:
World Development Indicators
Source organization:
IEA Statistics © OECD/IEA 2014 (http://www.iea.org/stats/index.asp), subject to https://www.iea.org/t&c/termsandconditions/
Categories, topics:
Environment
Last updated:
apr 23, 2017
Indicators value changes by year
Minimum:
15.877
jan 1, 1976
Maximum:
36.041
jan 1, 2015
At the date of observation
Value
Absolute change
Change from previous value
jan 1, 1972
15.968
+15.968
0.0%
jan 1, 1973
16.048
+0.08
0.5%
jan 1, 1974
16.06
+0.012
0.07%
jan 1, 1975
16.763
+0.703
4.38%
jan 1, 1976
15.877
-0.886
-5.29%
jan 1, 1977
16.966
+1.09
6.86%
jan 1, 1978
16.958
-0.008
-0.05%
jan 1, 1979
16.727
-0.231
-1.36%
jan 1, 1980
16.219
-0.508
-3.04%
jan 1, 1981
18.63
+2.411
14.86%
jan 1, 1982
19.759
+1.129
6.06%
jan 1, 1983
20.809
+1.05
5.31%
jan 1, 1984
22.079
+1.27
6.1%
jan 1, 1985
23.153
+1.073
4.86%
jan 1, 1986
25.537
+2.384
10.3%
jan 1, 1987
26.042
+0.505
1.98%
jan 1, 1988
28.307
+2.265
8.7%
jan 1, 1989
28.841
+0.534
1.89%
jan 1, 1990
28.57
-0.271
-0.94%
jan 1, 1991
32.206
+3.637
12.73%
jan 1, 1992
33.063
+0.857
2.66%
jan 1, 1993
35.279
+2.216
6.7%
jan 1, 1994
34.724
-0.555
-1.57%
jan 1, 1995
34.471
-0.253
-0.73%
jan 1, 1996
33.651
-0.82
-2.38%
jan 1, 1997
33.609
-0.043
-0.13%
jan 1, 1998
33.699
+0.09
0.27%
jan 1, 1999
33.533
-0.166
-0.49%
jan 1, 2000
33.585
+0.051
0.15%
jan 1, 2001
35.031
+1.446
4.31%
jan 1, 2002
35.01
-0.022
-0.06%
jan 1, 2003
35.135
+0.126
0.36%
jan 1, 2004
33.401
-1.734
-4.93%
jan 1, 2005
34.214
+0.812
2.43%
jan 1, 2006
35.072
+0.859
2.51%
jan 1, 2007
35.638
+0.566
1.61%
jan 1, 2008
35.297
-0.341
-0.96%
jan 1, 2009
34.764
-0.533
-1.51%
jan 1, 2010
35.781
+1.016
2.92%
jan 1, 2011
35.957
+0.176
0.49%
jan 1, 2012
35.3
-0.657
-1.83%
jan 1, 2013
35.15
-0.15
-0.43%
jan 1, 2014
35.67
+0.52
1.48%
jan 1, 2015
36.041
+0.371
1.04%
Ranking of countries by current statistics by years


Comments: