29
/
en
AIzaSyAYiBZKx7MnpbEhh9jyipgxe19OcubqV5w
April 1, 2024
286939
Zimbabwe
ZWE
true
2
1
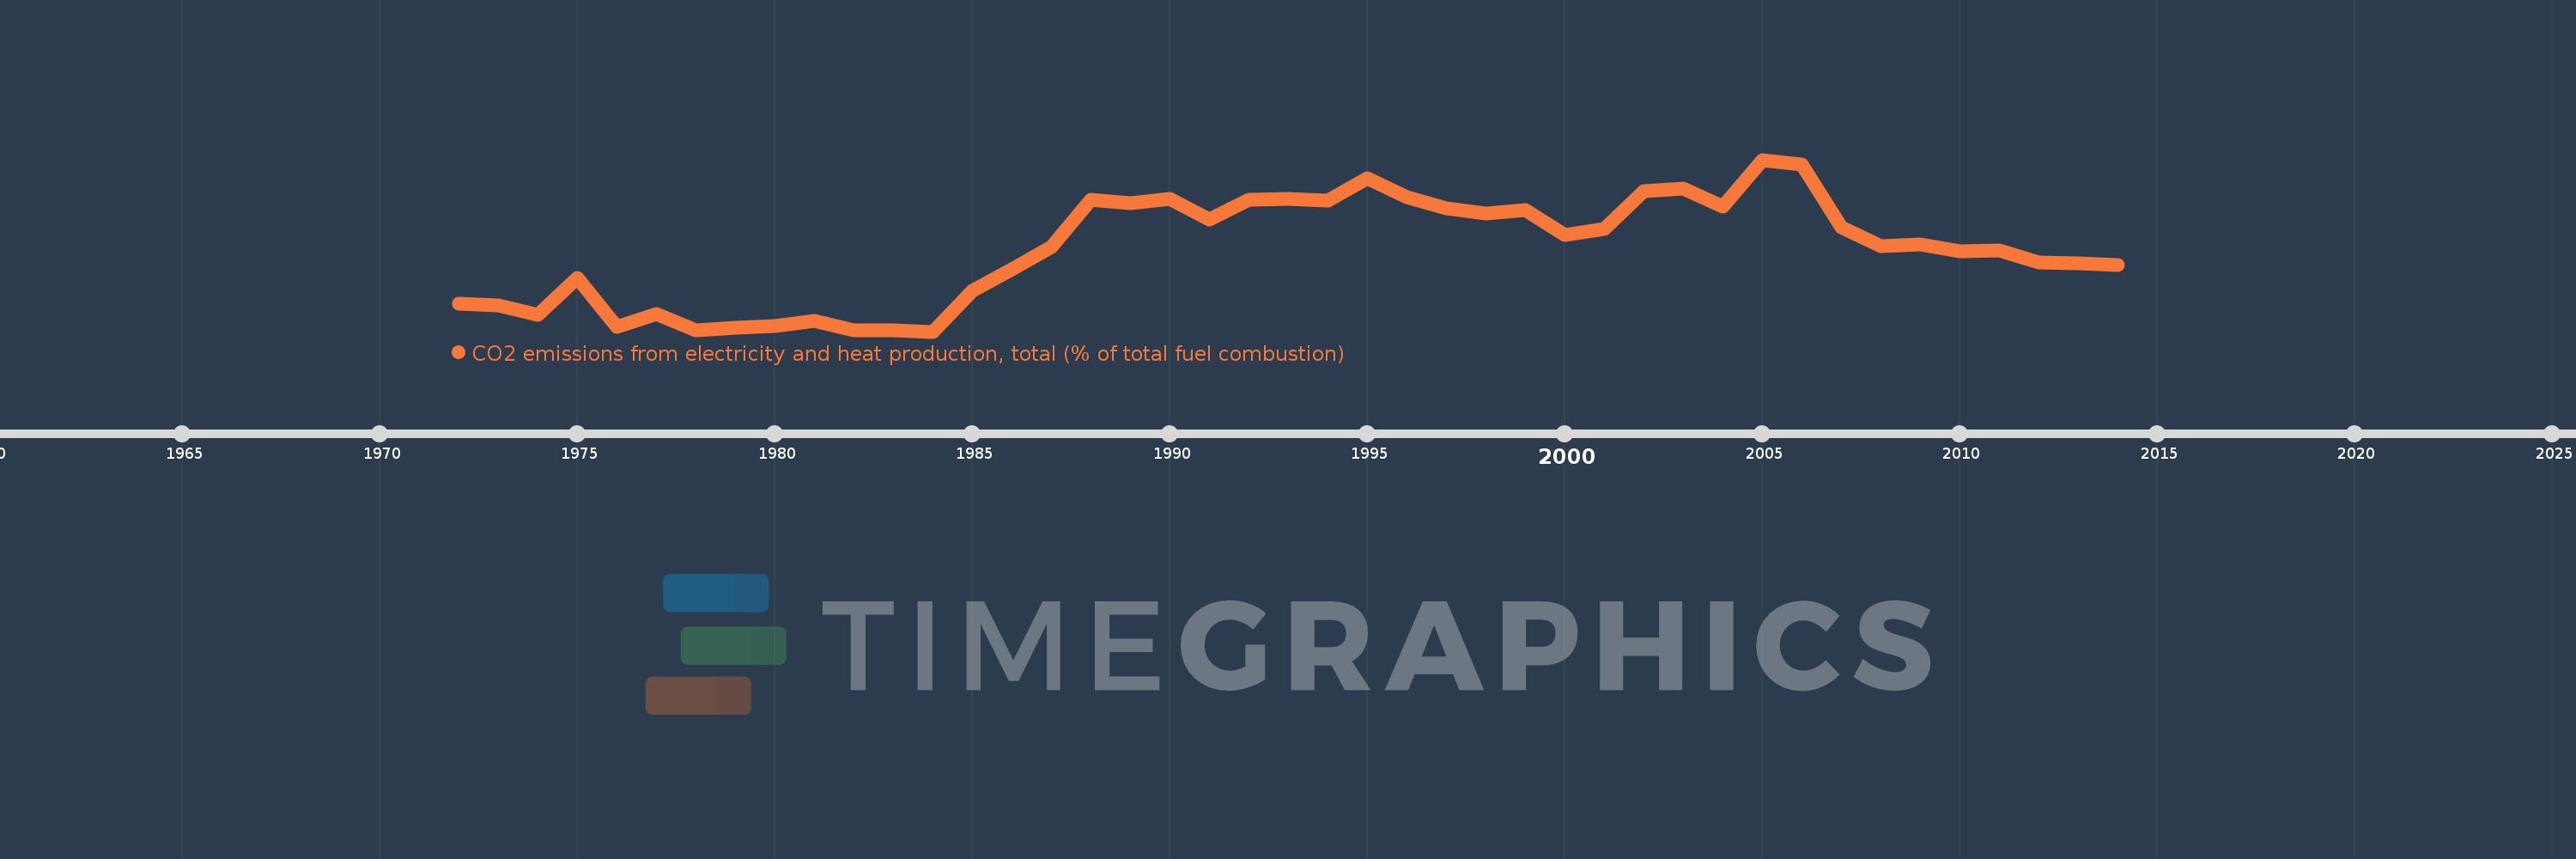
CO2 emissions from electricity and heat production, total (% of total fuel combustion)
2014,2013,2012,2011,2010,2009,2008,2007,2006,2005,2004,2003,2002,2001,2000,1999,1998,1997,1996,1995,1994,1993,1992,1991,1990,1989,1988,1987,1986,1985,1984,1983,1982,1981,1980,1979,1978,1977,1976,1975,1974,1973,1972
This statistics in other country:
AlbaniaAlgeriaAngolaArab WorldArgentinaArmeniaAustraliaAustriaAzerbaijanBahrainBangladeshBelarusBelgiumBeninBoliviaBosnia and HerzegovinaBotswanaBrazilBrunei DarussalamBulgariaCambodiaCameroonCanadaCaribbean small statesCentral Europe and the BalticsChileChinaColombiaCongo, Dem. Rep.Congo, Rep.Costa RicaCote d'IvoireCroatiaCubaCuracaoCyprusCzech RepublicDenmarkDominican RepublicEarly-demographic dividendEast Asia & PacificEast Asia & Pacific (excluding high income)East Asia & Pacific (IDA & IBRD countries)EcuadorEgypt, Arab Rep.El SalvadorEritreaEstoniaEthiopiaEuro areaEurope & Central AsiaEurope & Central Asia (excluding high income)Europe & Central Asia (IDA & IBRD countries)European UnionFinlandFragile and conflict affected situationsFranceGabonGeorgiaGermanyGhanaGibraltarGreeceGuatemalaHaitiHeavily indebted poor countries (HIPC)High incomeHondurasHong Kong SAR, ChinaHungaryIBRD onlyIcelandIDA & IBRD totalIDA blendIDA onlyIDA totalIndiaIndonesiaIran, Islamic Rep.IraqIrelandIsraelItalyJamaicaJapanJordanKazakhstanKenyaKorea, Dem. People’s Rep.Korea, Rep.KosovoKuwaitKyrgyz RepublicLate-demographic dividendLatin America & Caribbean Latin America & Caribbean (excluding high income)Latin America & the Caribbean (IDA & IBRD countries)LatviaLeast developed countries: UN classificationLebanonLibyaLithuaniaLow & middle incomeLow incomeLower middle incomeLuxembourgMacedonia, FYRMalaysiaMaltaMauritiusMexicoMiddle East & North AfricaMiddle East & North Africa (excluding high income)Middle East & North Africa (IDA & IBRD countries)Middle incomeMoldovaMongoliaMontenegroMoroccoMozambiqueMyanmarNamibiaNepalNetherlandsNew ZealandNicaraguaNigerNigeriaNorth AmericaNorwayOECD membersOmanOther small statesPakistanPanamaParaguayPeruPhilippinesPolandPortugalPost-demographic dividendPre-demographic dividendQatarRomaniaRussian FederationSaudi ArabiaSenegalSerbiaSingaporeSlovak RepublicSloveniaSmall statesSouth AfricaSouth AsiaSouth Asia (IDA & IBRD)South SudanSpainSri LankaSub-Saharan Africa Sub-Saharan Africa (excluding high income)Sub-Saharan Africa (IDA & IBRD countries)SudanSwedenSwitzerlandSyrian Arab RepublicTajikistanTanzaniaThailandTogoTrinidad and TobagoTunisiaTurkeyTurkmenistanUkraineUnited Arab EmiratesUnited KingdomUnited StatesUpper middle incomeUruguayUzbekistanVenezuela, RBVietnamWorldYemen, Rep.ZambiaZimbabwe Timeline:
This timeline shows a graph from 1972 to 2014 of Zimbabwe. No data until 1971. Number of actual observations by date: 43.
Source name:
World Development Indicators
Source organization:
IEA Statistics © OECD/IEA 2014 (http://www.iea.org/stats/index.asp), subject to https://www.iea.org/t&c/termsandconditions/
Categories, topics:
Environment
Last updated:
apr 23, 2017
Indicators value changes by year
Minimum:
10.861
jan 1, 1984
At the date of observation
Value
Absolute change
Change from previous value
jan 1, 1972
18.759
+18.759
0.0%
jan 1, 1973
18.341
-0.418
-2.23%
jan 1, 1974
15.73
-2.61
-14.23%
jan 1, 1975
26.11
+10.379
65.98%
jan 1, 1976
12.134
-13.976
-53.53%
jan 1, 1977
15.789
+3.656
30.13%
jan 1, 1978
11.143
-4.646
-29.43%
jan 1, 1979
12.023
+0.879
7.89%
jan 1, 1980
12.393
+0.371
3.08%
jan 1, 1981
13.927
+1.534
12.38%
jan 1, 1982
11.321
-2.606
-18.71%
jan 1, 1983
11.34
+0.019
0.17%
jan 1, 1984
10.861
-0.479
-4.22%
jan 1, 1985
22.53
+11.669
107.43%
jan 1, 1986
28.777
+6.247
27.73%
jan 1, 1987
35.133
+6.356
22.09%
jan 1, 1988
48.542
+13.409
38.17%
jan 1, 1989
47.684
-0.858
-1.77%
jan 1, 1990
48.855
+1.171
2.46%
jan 1, 1991
43.015
-5.84
-11.95%
jan 1, 1992
48.606
+5.591
13.0%
jan 1, 1993
48.729
+0.123
0.25%
jan 1, 1994
48.35
-0.379
-0.78%
jan 1, 1995
54.832
+6.482
13.41%
jan 1, 1996
49.37
-5.462
-9.96%
jan 1, 1997
46.228
-3.142
-6.36%
jan 1, 1998
44.544
-1.684
-3.64%
jan 1, 1999
45.521
+0.977
2.19%
jan 1, 2000
38.611
-6.91
-15.18%
jan 1, 2001
40.331
+1.72
4.45%
jan 1, 2002
51.032
+10.701
26.53%
jan 1, 2003
51.879
+0.847
1.66%
jan 1, 2004
46.66
-5.219
-10.06%
jan 1, 2005
60.0
+13.34
28.59%
jan 1, 2006
58.755
-1.245
-2.08%
jan 1, 2007
40.625
-18.13
-30.86%
jan 1, 2008
35.343
-5.282
-13.0%
jan 1, 2009
35.753
+0.41
1.16%
jan 1, 2010
33.907
-1.846
-5.16%
jan 1, 2011
33.96
+0.054
0.16%
jan 1, 2012
30.634
-3.326
-9.79%
jan 1, 2013
30.435
-0.199
-0.65%
jan 1, 2014
29.941
-0.494
-1.62%
Ranking of countries by current statistics by years


Comments: