29
/
en
AIzaSyAYiBZKx7MnpbEhh9jyipgxe19OcubqV5w
April 1, 2024
34811
Heavily indebted poor countries (HIPC)
HPC
false
2
1
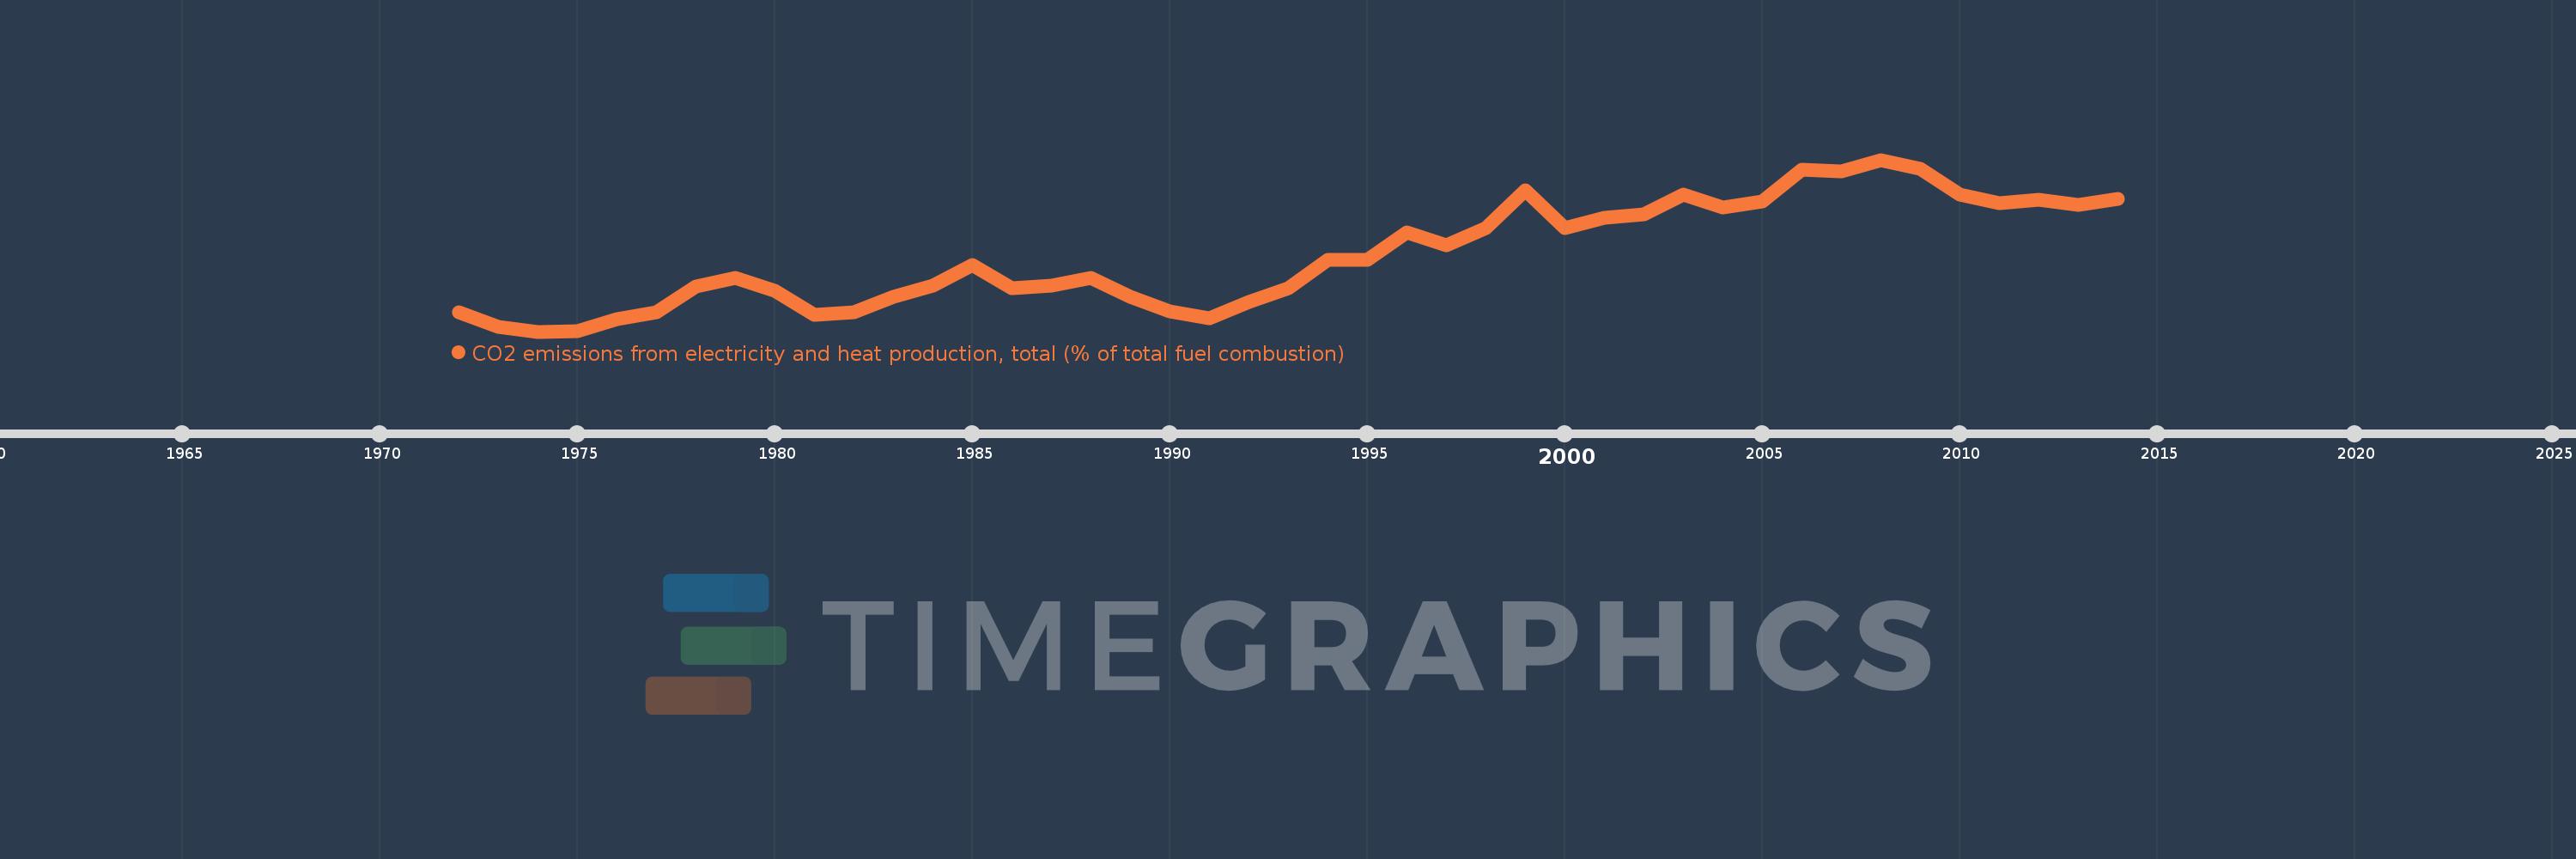
CO2 emissions from electricity and heat production, total (% of total fuel combustion)
2014,2013,2012,2011,2010,2009,2008,2007,2006,2005,2004,2003,2002,2001,2000,1999,1998,1997,1996,1995,1994,1993,1992,1991,1990,1989,1988,1987,1986,1985,1984,1983,1982,1981,1980,1979,1978,1977,1976,1975,1974,1973,1972
This statistics in other country:
AlbaniaAlgeriaAngolaArab WorldArgentinaArmeniaAustraliaAustriaAzerbaijanBahrainBangladeshBelarusBelgiumBeninBoliviaBosnia and HerzegovinaBotswanaBrazilBrunei DarussalamBulgariaCambodiaCameroonCanadaCaribbean small statesCentral Europe and the BalticsChileChinaColombiaCongo, Dem. Rep.Congo, Rep.Costa RicaCote d'IvoireCroatiaCubaCuracaoCyprusCzech RepublicDenmarkDominican RepublicEarly-demographic dividendEast Asia & PacificEast Asia & Pacific (excluding high income)East Asia & Pacific (IDA & IBRD countries)EcuadorEgypt, Arab Rep.El SalvadorEritreaEstoniaEthiopiaEuro areaEurope & Central AsiaEurope & Central Asia (excluding high income)Europe & Central Asia (IDA & IBRD countries)European UnionFinlandFragile and conflict affected situationsFranceGabonGeorgiaGermanyGhanaGibraltarGreeceGuatemalaHaitiHeavily indebted poor countries (HIPC)High incomeHondurasHong Kong SAR, ChinaHungaryIBRD onlyIcelandIDA & IBRD totalIDA blendIDA onlyIDA totalIndiaIndonesiaIran, Islamic Rep.IraqIrelandIsraelItalyJamaicaJapanJordanKazakhstanKenyaKorea, Dem. People’s Rep.Korea, Rep.KosovoKuwaitKyrgyz RepublicLate-demographic dividendLatin America & Caribbean Latin America & Caribbean (excluding high income)Latin America & the Caribbean (IDA & IBRD countries)LatviaLeast developed countries: UN classificationLebanonLibyaLithuaniaLow & middle incomeLow incomeLower middle incomeLuxembourgMacedonia, FYRMalaysiaMaltaMauritiusMexicoMiddle East & North AfricaMiddle East & North Africa (excluding high income)Middle East & North Africa (IDA & IBRD countries)Middle incomeMoldovaMongoliaMontenegroMoroccoMozambiqueMyanmarNamibiaNepalNetherlandsNew ZealandNicaraguaNigerNigeriaNorth AmericaNorwayOECD membersOmanOther small statesPakistanPanamaParaguayPeruPhilippinesPolandPortugalPost-demographic dividendPre-demographic dividendQatarRomaniaRussian FederationSaudi ArabiaSenegalSerbiaSingaporeSlovak RepublicSloveniaSmall statesSouth AfricaSouth AsiaSouth Asia (IDA & IBRD)South SudanSpainSri LankaSub-Saharan Africa Sub-Saharan Africa (excluding high income)Sub-Saharan Africa (IDA & IBRD countries)SudanSwedenSwitzerlandSyrian Arab RepublicTajikistanTanzaniaThailandTogoTrinidad and TobagoTunisiaTurkeyTurkmenistanUkraineUnited Arab EmiratesUnited KingdomUnited StatesUpper middle incomeUruguayUzbekistanVenezuela, RBVietnamWorldYemen, Rep.ZambiaZimbabwe Timeline:
This timeline shows a graph from 1972 to 2014 of Heavily indebted poor countries (HIPC). No data until 1971. Number of actual observations by date: 43.
Source name:
World Development Indicators
Source organization:
IEA Statistics © OECD/IEA 2014 (http://www.iea.org/stats/index.asp), subject to https://www.iea.org/t&c/termsandconditions/
Categories, topics:
Environment
Last updated:
apr 23, 2017
Indicators value changes by year
Maximum:
25.915
jan 1, 2008
At the date of observation
Value
Absolute change
Change from previous value
jan 1, 1972
15.233
+15.233
0.0%
jan 1, 1973
14.216
-1.017
-6.68%
jan 1, 1974
13.9
-0.316
-2.22%
jan 1, 1975
13.931
+0.03
0.22%
jan 1, 1976
14.792
+0.862
6.19%
jan 1, 1977
15.238
+0.446
3.01%
jan 1, 1978
17.027
+1.789
11.74%
jan 1, 1979
17.626
+0.599
3.52%
jan 1, 1980
16.762
-0.864
-4.9%
jan 1, 1981
15.096
-1.666
-9.94%
jan 1, 1982
15.277
+0.181
1.2%
jan 1, 1983
16.357
+1.08
7.07%
jan 1, 1984
17.09
+0.733
4.48%
jan 1, 1985
18.545
+1.455
8.51%
jan 1, 1986
16.956
-1.589
-8.57%
jan 1, 1987
17.085
+0.129
0.76%
jan 1, 1988
17.635
+0.551
3.22%
jan 1, 1989
16.347
-1.288
-7.31%
jan 1, 1990
15.318
-1.029
-6.29%
jan 1, 1991
14.822
-0.496
-3.24%
jan 1, 1992
15.987
+1.166
7.86%
jan 1, 1993
16.956
+0.969
6.06%
jan 1, 1994
18.936
+1.98
11.68%
jan 1, 1995
18.917
-0.019
-0.1%
jan 1, 1996
20.85
+1.932
10.21%
jan 1, 1997
19.967
-0.883
-4.23%
jan 1, 1998
21.136
+1.169
5.86%
jan 1, 1999
23.756
+2.619
12.39%
jan 1, 2000
21.136
-2.62
-11.03%
jan 1, 2001
21.866
+0.73
3.45%
jan 1, 2002
22.077
+0.211
0.96%
jan 1, 2003
23.48
+1.403
6.35%
jan 1, 2004
22.569
-0.91
-3.88%
jan 1, 2005
22.992
+0.422
1.87%
jan 1, 2006
25.217
+2.226
9.68%
jan 1, 2007
25.132
-0.085
-0.34%
jan 1, 2008
25.915
+0.783
3.11%
jan 1, 2009
25.305
-0.609
-2.35%
jan 1, 2010
23.5
-1.805
-7.13%
jan 1, 2011
22.877
-0.623
-2.65%
jan 1, 2012
23.145
+0.268
1.17%
jan 1, 2013
22.756
-0.39
-1.68%
jan 1, 2014
23.199
+0.443
1.95%
Ranking of countries by current statistics by years


Comments: