29
/
en
AIzaSyAYiBZKx7MnpbEhh9jyipgxe19OcubqV5w
April 1, 2024
23950
Arab World
ARB
false
2
1
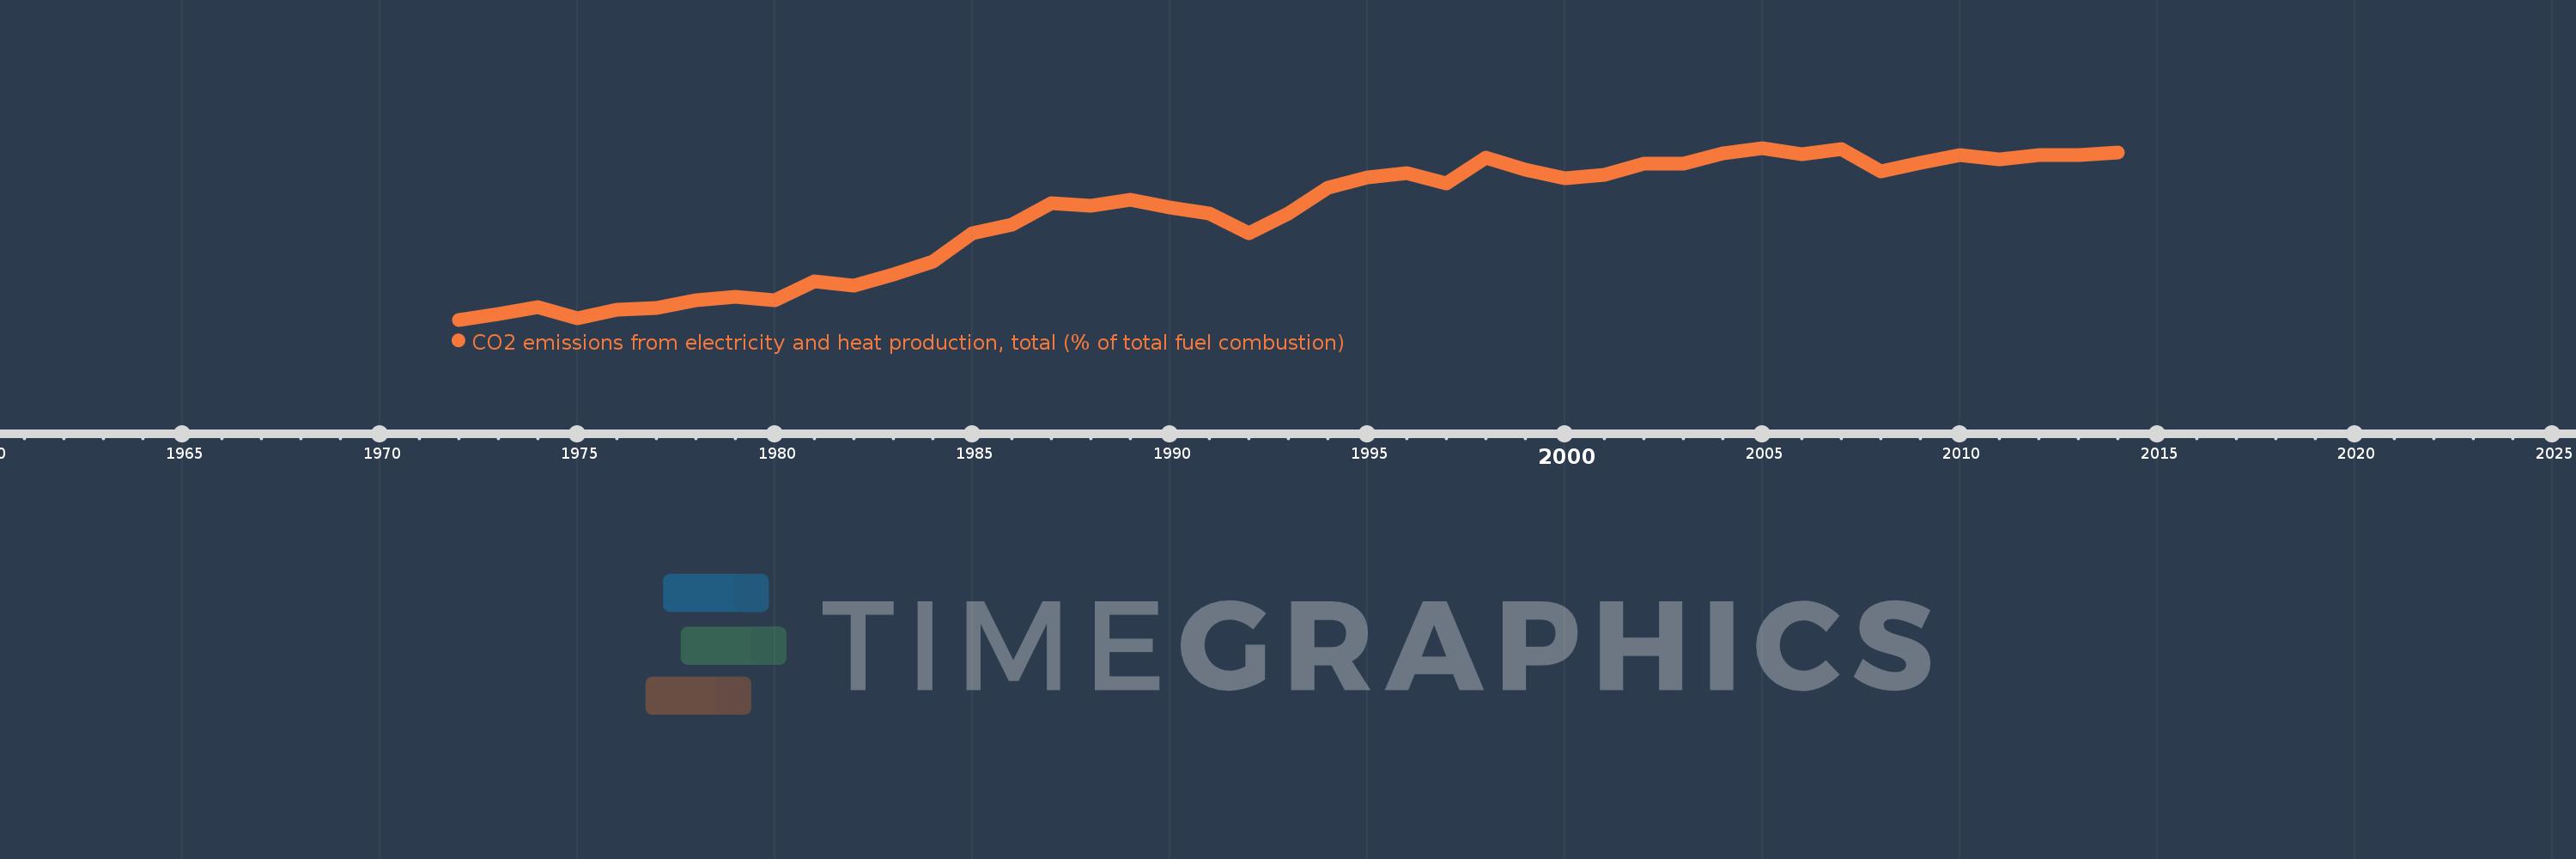
CO2 emissions from electricity and heat production, total (% of total fuel combustion)
2014,2013,2012,2011,2010,2009,2008,2007,2006,2005,2004,2003,2002,2001,2000,1999,1998,1997,1996,1995,1994,1993,1992,1991,1990,1989,1988,1987,1986,1985,1984,1983,1982,1981,1980,1979,1978,1977,1976,1975,1974,1973,1972
This statistics in other country:
AlbaniaAlgeriaAngolaArab WorldArgentinaArmeniaAustraliaAustriaAzerbaijanBahrainBangladeshBelarusBelgiumBeninBoliviaBosnia and HerzegovinaBotswanaBrazilBrunei DarussalamBulgariaCambodiaCameroonCanadaCaribbean small statesCentral Europe and the BalticsChileChinaColombiaCongo, Dem. Rep.Congo, Rep.Costa RicaCote d'IvoireCroatiaCubaCuracaoCyprusCzech RepublicDenmarkDominican RepublicEarly-demographic dividendEast Asia & PacificEast Asia & Pacific (excluding high income)East Asia & Pacific (IDA & IBRD countries)EcuadorEgypt, Arab Rep.El SalvadorEritreaEstoniaEthiopiaEuro areaEurope & Central AsiaEurope & Central Asia (excluding high income)Europe & Central Asia (IDA & IBRD countries)European UnionFinlandFragile and conflict affected situationsFranceGabonGeorgiaGermanyGhanaGibraltarGreeceGuatemalaHaitiHeavily indebted poor countries (HIPC)High incomeHondurasHong Kong SAR, ChinaHungaryIBRD onlyIcelandIDA & IBRD totalIDA blendIDA onlyIDA totalIndiaIndonesiaIran, Islamic Rep.IraqIrelandIsraelItalyJamaicaJapanJordanKazakhstanKenyaKorea, Dem. People’s Rep.Korea, Rep.KosovoKuwaitKyrgyz RepublicLate-demographic dividendLatin America & Caribbean Latin America & Caribbean (excluding high income)Latin America & the Caribbean (IDA & IBRD countries)LatviaLeast developed countries: UN classificationLebanonLibyaLithuaniaLow & middle incomeLow incomeLower middle incomeLuxembourgMacedonia, FYRMalaysiaMaltaMauritiusMexicoMiddle East & North AfricaMiddle East & North Africa (excluding high income)Middle East & North Africa (IDA & IBRD countries)Middle incomeMoldovaMongoliaMontenegroMoroccoMozambiqueMyanmarNamibiaNepalNetherlandsNew ZealandNicaraguaNigerNigeriaNorth AmericaNorwayOECD membersOmanOther small statesPakistanPanamaParaguayPeruPhilippinesPolandPortugalPost-demographic dividendPre-demographic dividendQatarRomaniaRussian FederationSaudi ArabiaSenegalSerbiaSingaporeSlovak RepublicSloveniaSmall statesSouth AfricaSouth AsiaSouth Asia (IDA & IBRD)South SudanSpainSri LankaSub-Saharan Africa Sub-Saharan Africa (excluding high income)Sub-Saharan Africa (IDA & IBRD countries)SudanSwedenSwitzerlandSyrian Arab RepublicTajikistanTanzaniaThailandTogoTrinidad and TobagoTunisiaTurkeyTurkmenistanUkraineUnited Arab EmiratesUnited KingdomUnited StatesUpper middle incomeUruguayUzbekistanVenezuela, RBVietnamWorldYemen, Rep.ZambiaZimbabwe Timeline:
This timeline shows a graph from 1972 to 2014 of Arab World. No data until 1971. Number of actual observations by date: 43.
Source name:
World Development Indicators
Source organization:
IEA Statistics © OECD/IEA 2014 (http://www.iea.org/stats/index.asp), subject to https://www.iea.org/t&c/termsandconditions/
Categories, topics:
Environment
Last updated:
apr 23, 2017
Indicators value changes by year
Minimum:
32.823
jan 1, 1972
Maximum:
49.073
jan 1, 2005
At the date of observation
Value
Absolute change
Change from previous value
jan 1, 1972
32.823
+32.823
0.0%
jan 1, 1973
33.385
+0.562
1.71%
jan 1, 1974
33.985
+0.6
1.8%
jan 1, 1975
32.928
-1.057
-3.11%
jan 1, 1976
33.773
+0.846
2.57%
jan 1, 1977
33.924
+0.151
0.45%
jan 1, 1978
34.707
+0.783
2.31%
jan 1, 1979
35.01
+0.303
0.87%
jan 1, 1980
34.673
-0.337
-0.96%
jan 1, 1981
36.476
+1.802
5.2%
jan 1, 1982
36.014
-0.461
-1.26%
jan 1, 1983
37.082
+1.067
2.96%
jan 1, 1984
38.291
+1.209
3.26%
jan 1, 1985
41.028
+2.737
7.15%
jan 1, 1986
41.832
+0.804
1.96%
jan 1, 1987
43.81
+1.979
4.73%
jan 1, 1988
43.567
-0.243
-0.55%
jan 1, 1989
44.186
+0.618
1.42%
jan 1, 1990
43.408
-0.778
-1.76%
jan 1, 1991
42.843
-0.565
-1.3%
jan 1, 1992
41.022
-1.821
-4.25%
jan 1, 1993
42.86
+1.838
4.48%
jan 1, 1994
45.331
+2.471
5.77%
jan 1, 1995
46.31
+0.979
2.16%
jan 1, 1996
46.674
+0.364
0.79%
jan 1, 1997
45.731
-0.944
-2.02%
jan 1, 1998
48.176
+2.445
5.35%
jan 1, 1999
47.001
-1.175
-2.44%
jan 1, 2000
46.243
-0.758
-1.61%
jan 1, 2001
46.518
+0.275
0.6%
jan 1, 2002
47.573
+1.055
2.27%
jan 1, 2003
47.554
-0.019
-0.04%
jan 1, 2004
48.567
+1.012
2.13%
jan 1, 2005
49.073
+0.506
1.04%
jan 1, 2006
48.504
-0.569
-1.16%
jan 1, 2007
48.971
+0.467
0.96%
jan 1, 2008
46.85
-2.121
-4.33%
jan 1, 2009
47.673
+0.824
1.76%
jan 1, 2010
48.388
+0.715
1.5%
jan 1, 2011
47.981
-0.407
-0.84%
jan 1, 2012
48.365
+0.384
0.8%
jan 1, 2013
48.423
+0.058
0.12%
jan 1, 2014
48.641
+0.218
0.45%
Ranking of countries by current statistics by years


Comments: