29
/
en
AIzaSyAYiBZKx7MnpbEhh9jyipgxe19OcubqV5w
April 1, 2024
203923
Myanmar
MMR
true
2
1
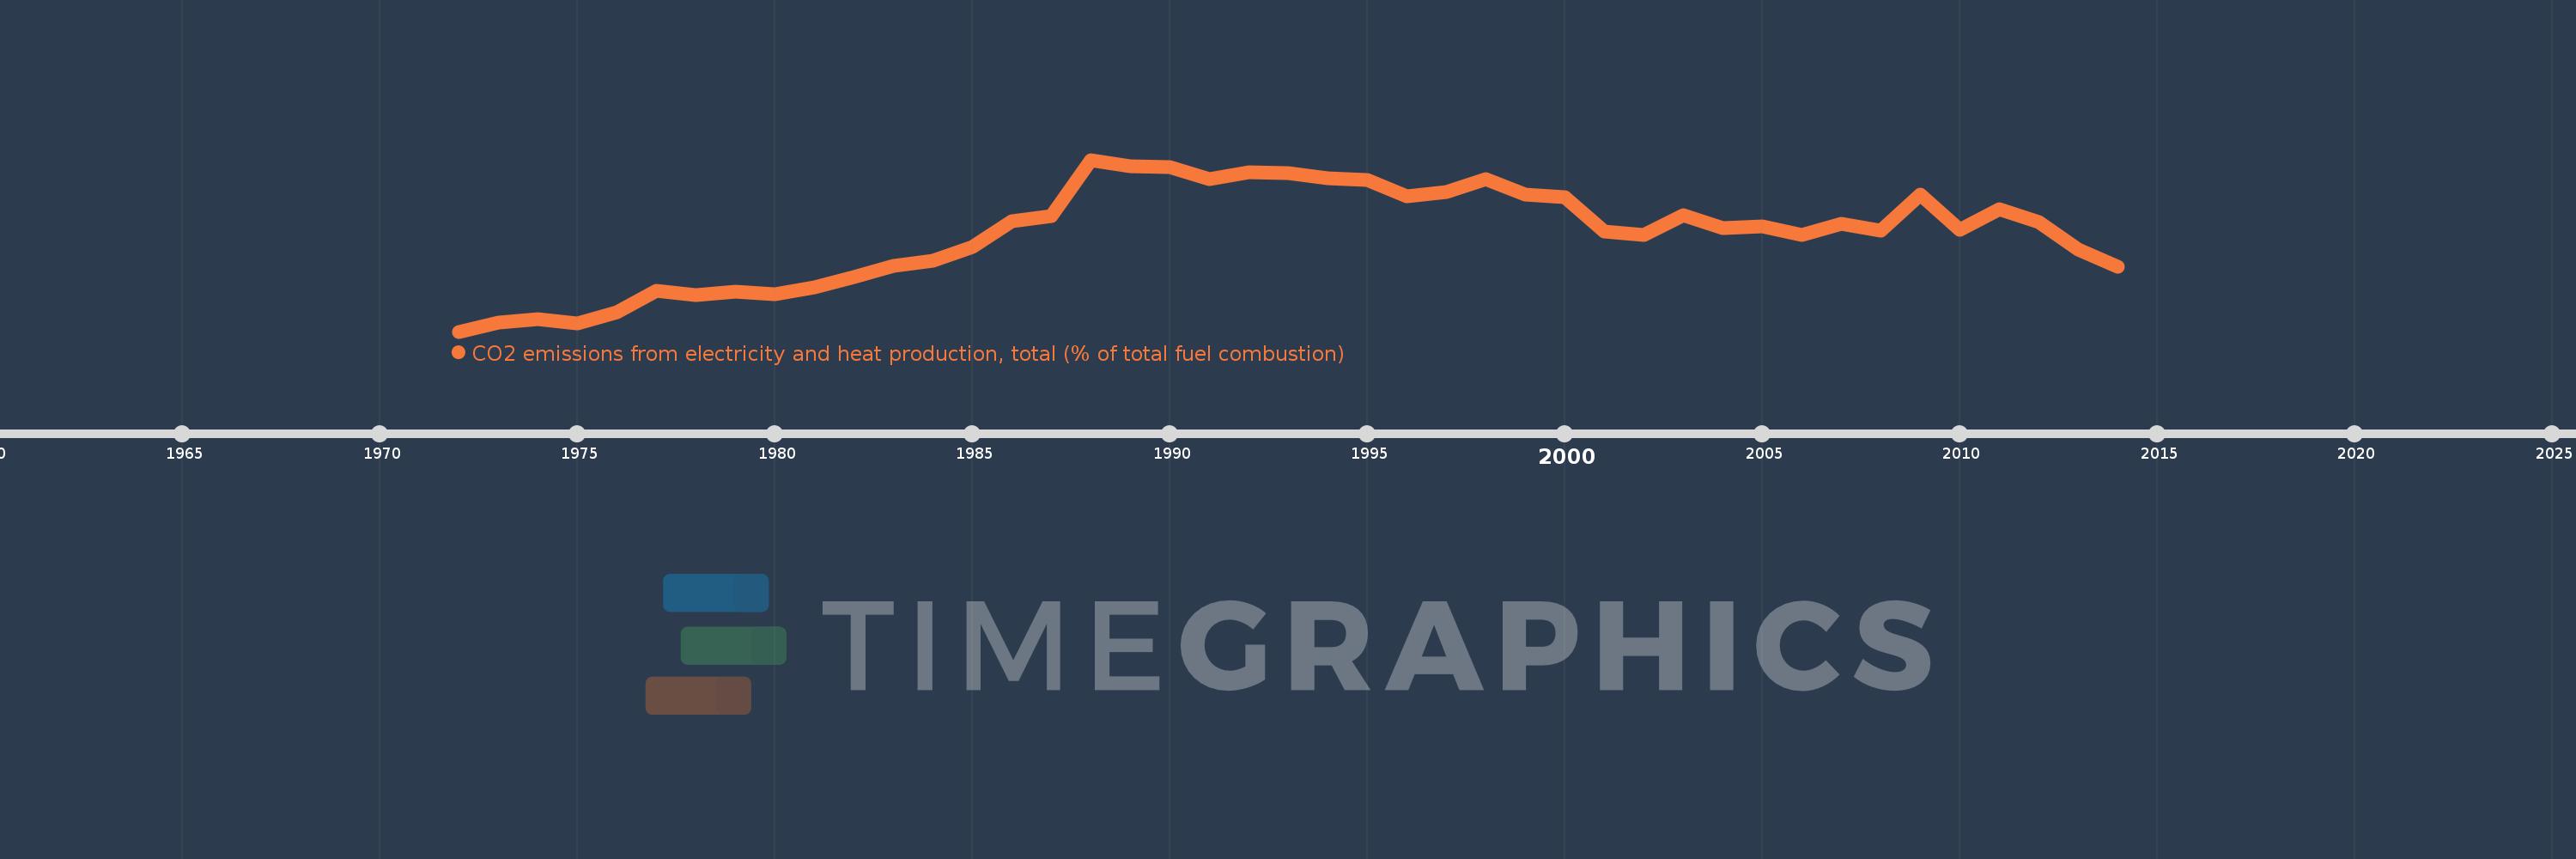
CO2 emissions from electricity and heat production, total (% of total fuel combustion)
2014,2013,2012,2011,2010,2009,2008,2007,2006,2005,2004,2003,2002,2001,2000,1999,1998,1997,1996,1995,1994,1993,1992,1991,1990,1989,1988,1987,1986,1985,1984,1983,1982,1981,1980,1979,1978,1977,1976,1975,1974,1973,1972
This statistics in other country:
AlbaniaAlgeriaAngolaArab WorldArgentinaArmeniaAustraliaAustriaAzerbaijanBahrainBangladeshBelarusBelgiumBeninBoliviaBosnia and HerzegovinaBotswanaBrazilBrunei DarussalamBulgariaCambodiaCameroonCanadaCaribbean small statesCentral Europe and the BalticsChileChinaColombiaCongo, Dem. Rep.Congo, Rep.Costa RicaCote d'IvoireCroatiaCubaCuracaoCyprusCzech RepublicDenmarkDominican RepublicEarly-demographic dividendEast Asia & PacificEast Asia & Pacific (excluding high income)East Asia & Pacific (IDA & IBRD countries)EcuadorEgypt, Arab Rep.El SalvadorEritreaEstoniaEthiopiaEuro areaEurope & Central AsiaEurope & Central Asia (excluding high income)Europe & Central Asia (IDA & IBRD countries)European UnionFinlandFragile and conflict affected situationsFranceGabonGeorgiaGermanyGhanaGibraltarGreeceGuatemalaHaitiHeavily indebted poor countries (HIPC)High incomeHondurasHong Kong SAR, ChinaHungaryIBRD onlyIcelandIDA & IBRD totalIDA blendIDA onlyIDA totalIndiaIndonesiaIran, Islamic Rep.IraqIrelandIsraelItalyJamaicaJapanJordanKazakhstanKenyaKorea, Dem. People’s Rep.Korea, Rep.KosovoKuwaitKyrgyz RepublicLate-demographic dividendLatin America & Caribbean Latin America & Caribbean (excluding high income)Latin America & the Caribbean (IDA & IBRD countries)LatviaLeast developed countries: UN classificationLebanonLibyaLithuaniaLow & middle incomeLow incomeLower middle incomeLuxembourgMacedonia, FYRMalaysiaMaltaMauritiusMexicoMiddle East & North AfricaMiddle East & North Africa (excluding high income)Middle East & North Africa (IDA & IBRD countries)Middle incomeMoldovaMongoliaMontenegroMoroccoMozambiqueMyanmarNamibiaNepalNetherlandsNew ZealandNicaraguaNigerNigeriaNorth AmericaNorwayOECD membersOmanOther small statesPakistanPanamaParaguayPeruPhilippinesPolandPortugalPost-demographic dividendPre-demographic dividendQatarRomaniaRussian FederationSaudi ArabiaSenegalSerbiaSingaporeSlovak RepublicSloveniaSmall statesSouth AfricaSouth AsiaSouth Asia (IDA & IBRD)South SudanSpainSri LankaSub-Saharan Africa Sub-Saharan Africa (excluding high income)Sub-Saharan Africa (IDA & IBRD countries)SudanSwedenSwitzerlandSyrian Arab RepublicTajikistanTanzaniaThailandTogoTrinidad and TobagoTunisiaTurkeyTurkmenistanUkraineUnited Arab EmiratesUnited KingdomUnited StatesUpper middle incomeUruguayUzbekistanVenezuela, RBVietnamWorldYemen, Rep.ZambiaZimbabwe Timeline:
This timeline shows a graph from 1972 to 2014 of Myanmar. No data until 1971. Number of actual observations by date: 43.
Source name:
World Development Indicators
Source organization:
IEA Statistics © OECD/IEA 2014 (http://www.iea.org/stats/index.asp), subject to https://www.iea.org/t&c/termsandconditions/
Categories, topics:
Environment
Last updated:
apr 23, 2017
Indicators value changes by year
Maximum:
44.568
jan 1, 1988
At the date of observation
Value
Absolute change
Change from previous value
jan 1, 1972
9.313
+9.313
0.0%
jan 1, 1973
11.162
+1.849
19.86%
jan 1, 1974
11.919
+0.757
6.78%
jan 1, 1975
10.945
-0.973
-8.17%
jan 1, 1976
13.232
+2.286
20.89%
jan 1, 1977
17.661
+4.43
33.48%
jan 1, 1978
16.741
-0.92
-5.21%
jan 1, 1979
17.457
+0.716
4.28%
jan 1, 1980
17.017
-0.44
-2.52%
jan 1, 1981
18.343
+1.326
7.79%
jan 1, 1982
20.559
+2.216
12.08%
jan 1, 1983
22.718
+2.16
10.5%
jan 1, 1984
23.896
+1.177
5.18%
jan 1, 1985
26.642
+2.747
11.49%
jan 1, 1986
31.937
+5.295
19.87%
jan 1, 1987
33.003
+1.066
3.34%
jan 1, 1988
44.568
+11.564
35.04%
jan 1, 1989
43.224
-1.343
-3.01%
jan 1, 1990
43.062
-0.162
-0.38%
jan 1, 1991
40.665
-2.397
-5.57%
jan 1, 1992
42.037
+1.372
3.37%
jan 1, 1993
41.809
-0.227
-0.54%
jan 1, 1994
40.86
-0.949
-2.27%
jan 1, 1995
40.367
-0.493
-1.21%
jan 1, 1996
37.054
-3.313
-8.21%
jan 1, 1997
37.887
+0.834
2.25%
jan 1, 1998
40.625
+2.738
7.23%
jan 1, 1999
37.371
-3.254
-8.01%
jan 1, 2000
36.903
-0.468
-1.25%
jan 1, 2001
29.849
-7.054
-19.12%
jan 1, 2002
29.146
-0.703
-2.35%
jan 1, 2003
33.128
+3.982
13.66%
jan 1, 2004
30.604
-2.524
-7.62%
jan 1, 2005
30.831
+0.227
0.74%
jan 1, 2006
29.206
-1.625
-5.27%
jan 1, 2007
31.493
+2.287
7.83%
jan 1, 2008
29.98
-1.512
-4.8%
jan 1, 2009
37.451
+7.47
24.92%
jan 1, 2010
30.127
-7.323
-19.55%
jan 1, 2011
34.43
+4.303
14.28%
jan 1, 2012
31.852
-2.579
-7.49%
jan 1, 2013
26.215
-5.637
-17.7%
jan 1, 2014
22.564
-3.652
-13.93%
Ranking of countries by current statistics by years


Comments: