29
/
en
AIzaSyAYiBZKx7MnpbEhh9jyipgxe19OcubqV5w
April 1, 2024
33284
European Union
EUU
false
2
1
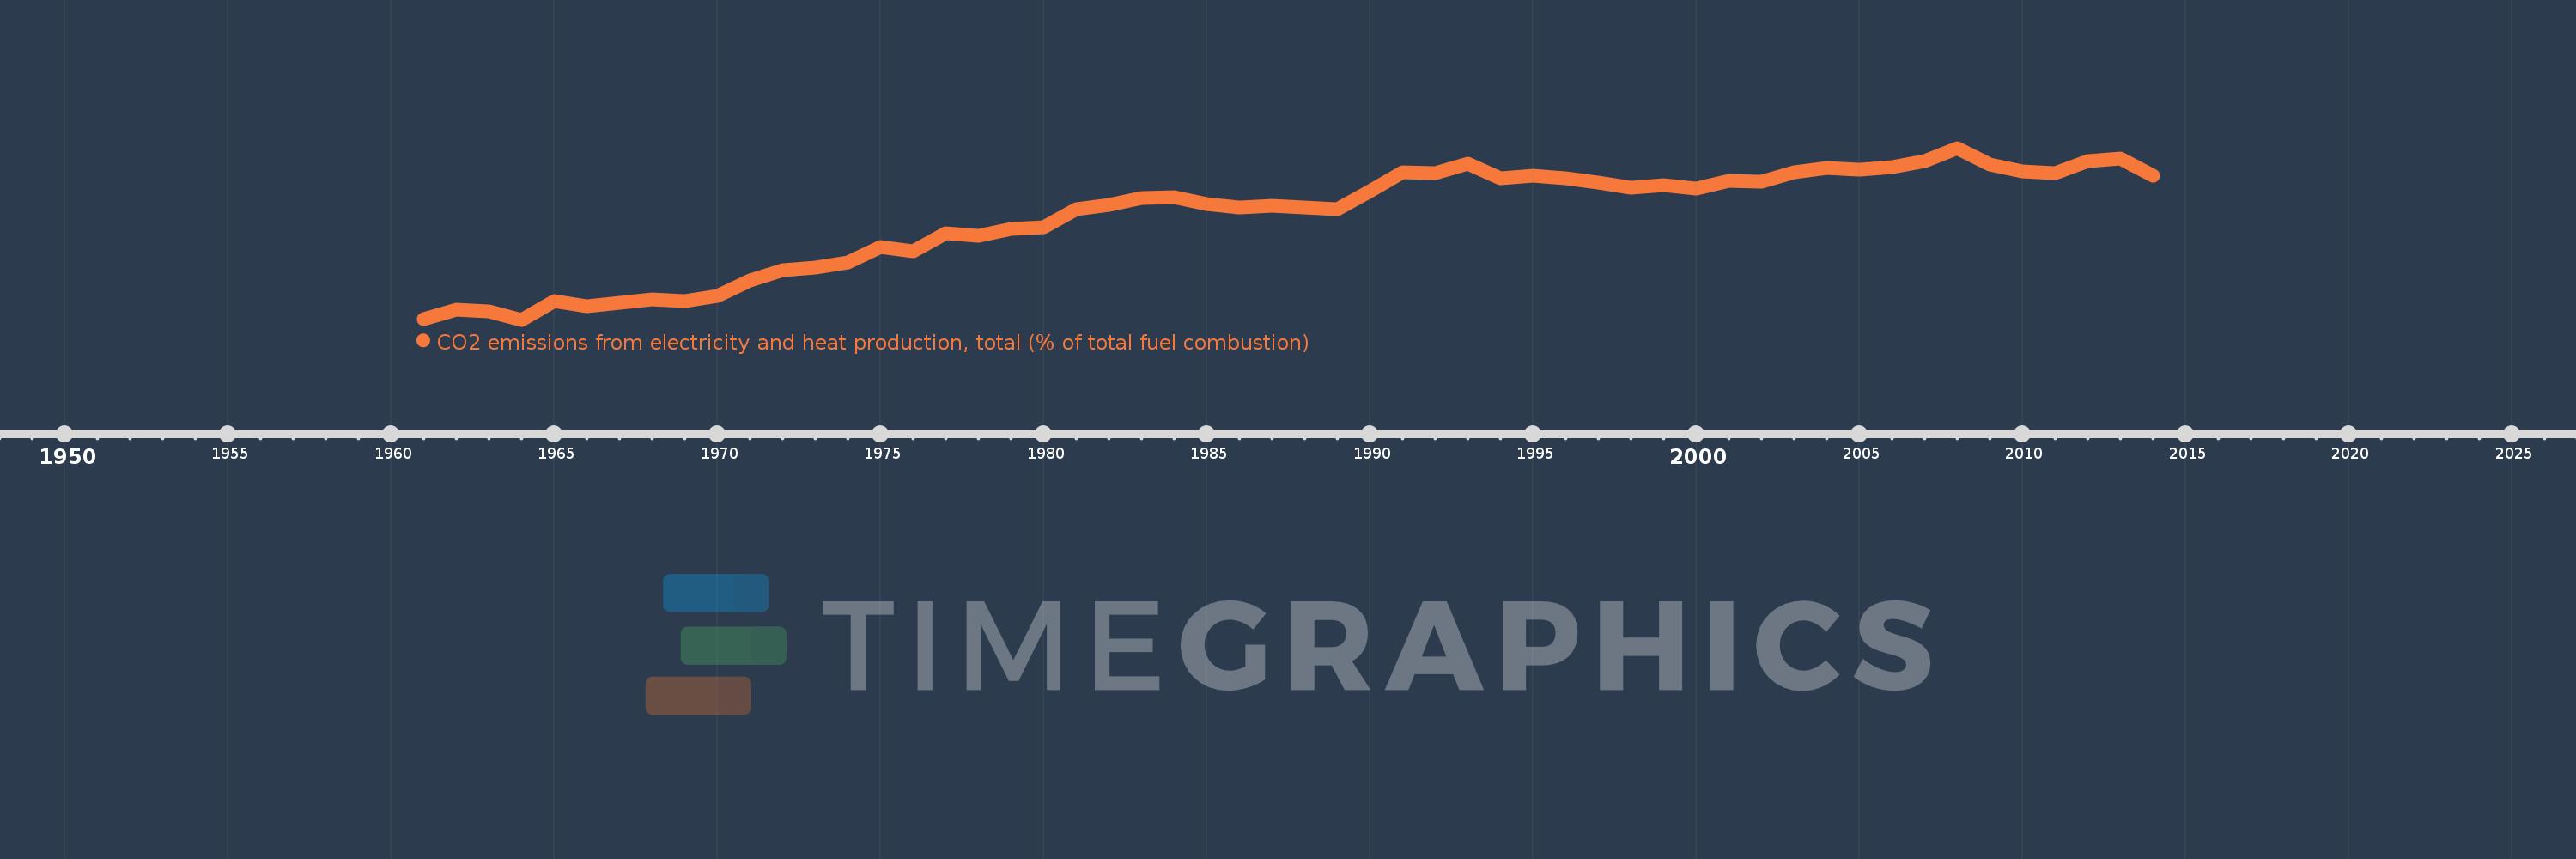
CO2 emissions from electricity and heat production, total (% of total fuel combustion)
2014,2013,2012,2011,2010,2009,2008,2007,2006,2005,2004,2003,2002,2001,2000,1999,1998,1997,1996,1995,1994,1993,1992,1991,1990,1989,1988,1987,1986,1985,1984,1983,1982,1981,1980,1979,1978,1977,1976,1975,1974,1973,1972,1971,1970,1969,1968,1967,1966,1965,1964,1963,1962,1961
This statistics in other country:
AlbaniaAlgeriaAngolaArab WorldArgentinaArmeniaAustraliaAustriaAzerbaijanBahrainBangladeshBelarusBelgiumBeninBoliviaBosnia and HerzegovinaBotswanaBrazilBrunei DarussalamBulgariaCambodiaCameroonCanadaCaribbean small statesCentral Europe and the BalticsChileChinaColombiaCongo, Dem. Rep.Congo, Rep.Costa RicaCote d'IvoireCroatiaCubaCuracaoCyprusCzech RepublicDenmarkDominican RepublicEarly-demographic dividendEast Asia & PacificEast Asia & Pacific (excluding high income)East Asia & Pacific (IDA & IBRD countries)EcuadorEgypt, Arab Rep.El SalvadorEritreaEstoniaEthiopiaEuro areaEurope & Central AsiaEurope & Central Asia (excluding high income)Europe & Central Asia (IDA & IBRD countries)European UnionFinlandFragile and conflict affected situationsFranceGabonGeorgiaGermanyGhanaGibraltarGreeceGuatemalaHaitiHeavily indebted poor countries (HIPC)High incomeHondurasHong Kong SAR, ChinaHungaryIBRD onlyIcelandIDA & IBRD totalIDA blendIDA onlyIDA totalIndiaIndonesiaIran, Islamic Rep.IraqIrelandIsraelItalyJamaicaJapanJordanKazakhstanKenyaKorea, Dem. People’s Rep.Korea, Rep.KosovoKuwaitKyrgyz RepublicLate-demographic dividendLatin America & Caribbean Latin America & Caribbean (excluding high income)Latin America & the Caribbean (IDA & IBRD countries)LatviaLeast developed countries: UN classificationLebanonLibyaLithuaniaLow & middle incomeLow incomeLower middle incomeLuxembourgMacedonia, FYRMalaysiaMaltaMauritiusMexicoMiddle East & North AfricaMiddle East & North Africa (excluding high income)Middle East & North Africa (IDA & IBRD countries)Middle incomeMoldovaMongoliaMontenegroMoroccoMozambiqueMyanmarNamibiaNepalNetherlandsNew ZealandNicaraguaNigerNigeriaNorth AmericaNorwayOECD membersOmanOther small statesPakistanPanamaParaguayPeruPhilippinesPolandPortugalPost-demographic dividendPre-demographic dividendQatarRomaniaRussian FederationSaudi ArabiaSenegalSerbiaSingaporeSlovak RepublicSloveniaSmall statesSouth AfricaSouth AsiaSouth Asia (IDA & IBRD)South SudanSpainSri LankaSub-Saharan Africa Sub-Saharan Africa (excluding high income)Sub-Saharan Africa (IDA & IBRD countries)SudanSwedenSwitzerlandSyrian Arab RepublicTajikistanTanzaniaThailandTogoTrinidad and TobagoTunisiaTurkeyTurkmenistanUkraineUnited Arab EmiratesUnited KingdomUnited StatesUpper middle incomeUruguayUzbekistanVenezuela, RBVietnamWorldYemen, Rep.ZambiaZimbabwe Timeline:
This timeline shows a graph from 1961 to 2014 of European Union. No data until 1960. Number of actual observations by date: 54.
Source name:
World Development Indicators
Source organization:
IEA Statistics © OECD/IEA 2014 (http://www.iea.org/stats/index.asp), subject to https://www.iea.org/t&c/termsandconditions/
Categories, topics:
Environment
Last updated:
apr 23, 2017
Indicators value changes by year
Minimum:
31.066
jan 1, 1964
Maximum:
44.371
jan 1, 2008
At the date of observation
Value
Absolute change
Change from previous value
jan 1, 1961
31.101
+31.101
0.0%
jan 1, 1962
31.856
+0.754
2.43%
jan 1, 1963
31.743
-0.112
-0.35%
jan 1, 1964
31.066
-0.677
-2.13%
jan 1, 1965
32.534
+1.468
4.72%
jan 1, 1966
32.088
-0.446
-1.37%
jan 1, 1967
32.385
+0.297
0.92%
jan 1, 1968
32.612
+0.227
0.7%
jan 1, 1969
32.517
-0.095
-0.29%
jan 1, 1970
32.896
+0.379
1.17%
jan 1, 1971
34.099
+1.203
3.66%
jan 1, 1972
34.918
+0.819
2.4%
jan 1, 1973
35.136
+0.218
0.62%
jan 1, 1974
35.536
+0.4
1.14%
jan 1, 1975
36.692
+1.155
3.25%
jan 1, 1976
36.344
-0.347
-0.95%
jan 1, 1977
37.77
+1.426
3.92%
jan 1, 1978
37.562
-0.208
-0.55%
jan 1, 1979
38.086
+0.523
1.39%
jan 1, 1980
38.226
+0.14
0.37%
jan 1, 1981
39.616
+1.39
3.64%
jan 1, 1982
39.93
+0.314
0.79%
jan 1, 1983
40.519
+0.59
1.48%
jan 1, 1984
40.533
+0.014
0.03%
jan 1, 1985
40.012
-0.522
-1.29%
jan 1, 1986
39.73
-0.282
-0.7%
jan 1, 1987
39.875
+0.145
0.36%
jan 1, 1988
39.736
-0.138
-0.35%
jan 1, 1989
39.6
-0.136
-0.34%
jan 1, 1990
40.998
+1.398
3.53%
jan 1, 1991
42.513
+1.515
3.69%
jan 1, 1992
42.408
-0.104
-0.25%
jan 1, 1993
43.121
+0.713
1.68%
jan 1, 1994
42.045
-1.076
-2.5%
jan 1, 1995
42.193
+0.148
0.35%
jan 1, 1996
42.022
-0.17
-0.4%
jan 1, 1997
41.663
-0.36
-0.86%
jan 1, 1998
41.3
-0.363
-0.87%
jan 1, 1999
41.501
+0.201
0.49%
jan 1, 2000
41.241
-0.259
-0.62%
jan 1, 2001
41.808
+0.567
1.37%
jan 1, 2002
41.741
-0.068
-0.16%
jan 1, 2003
42.473
+0.732
1.75%
jan 1, 2004
42.791
+0.318
0.75%
jan 1, 2005
42.679
-0.112
-0.26%
jan 1, 2006
42.86
+0.181
0.42%
jan 1, 2007
43.376
+0.515
1.2%
jan 1, 2008
44.371
+0.995
2.29%
jan 1, 2009
43.059
-1.312
-2.96%
jan 1, 2010
42.529
-0.53
-1.23%
jan 1, 2011
42.439
-0.09
-0.21%
jan 1, 2012
43.344
+0.905
2.13%
jan 1, 2013
43.571
+0.227
0.52%
jan 1, 2014
42.205
-1.366
-3.13%
Ranking of countries by current statistics by years


Comments: