29
/
en
AIzaSyAYiBZKx7MnpbEhh9jyipgxe19OcubqV5w
April 1, 2024
154341
India
IND
true
2
1
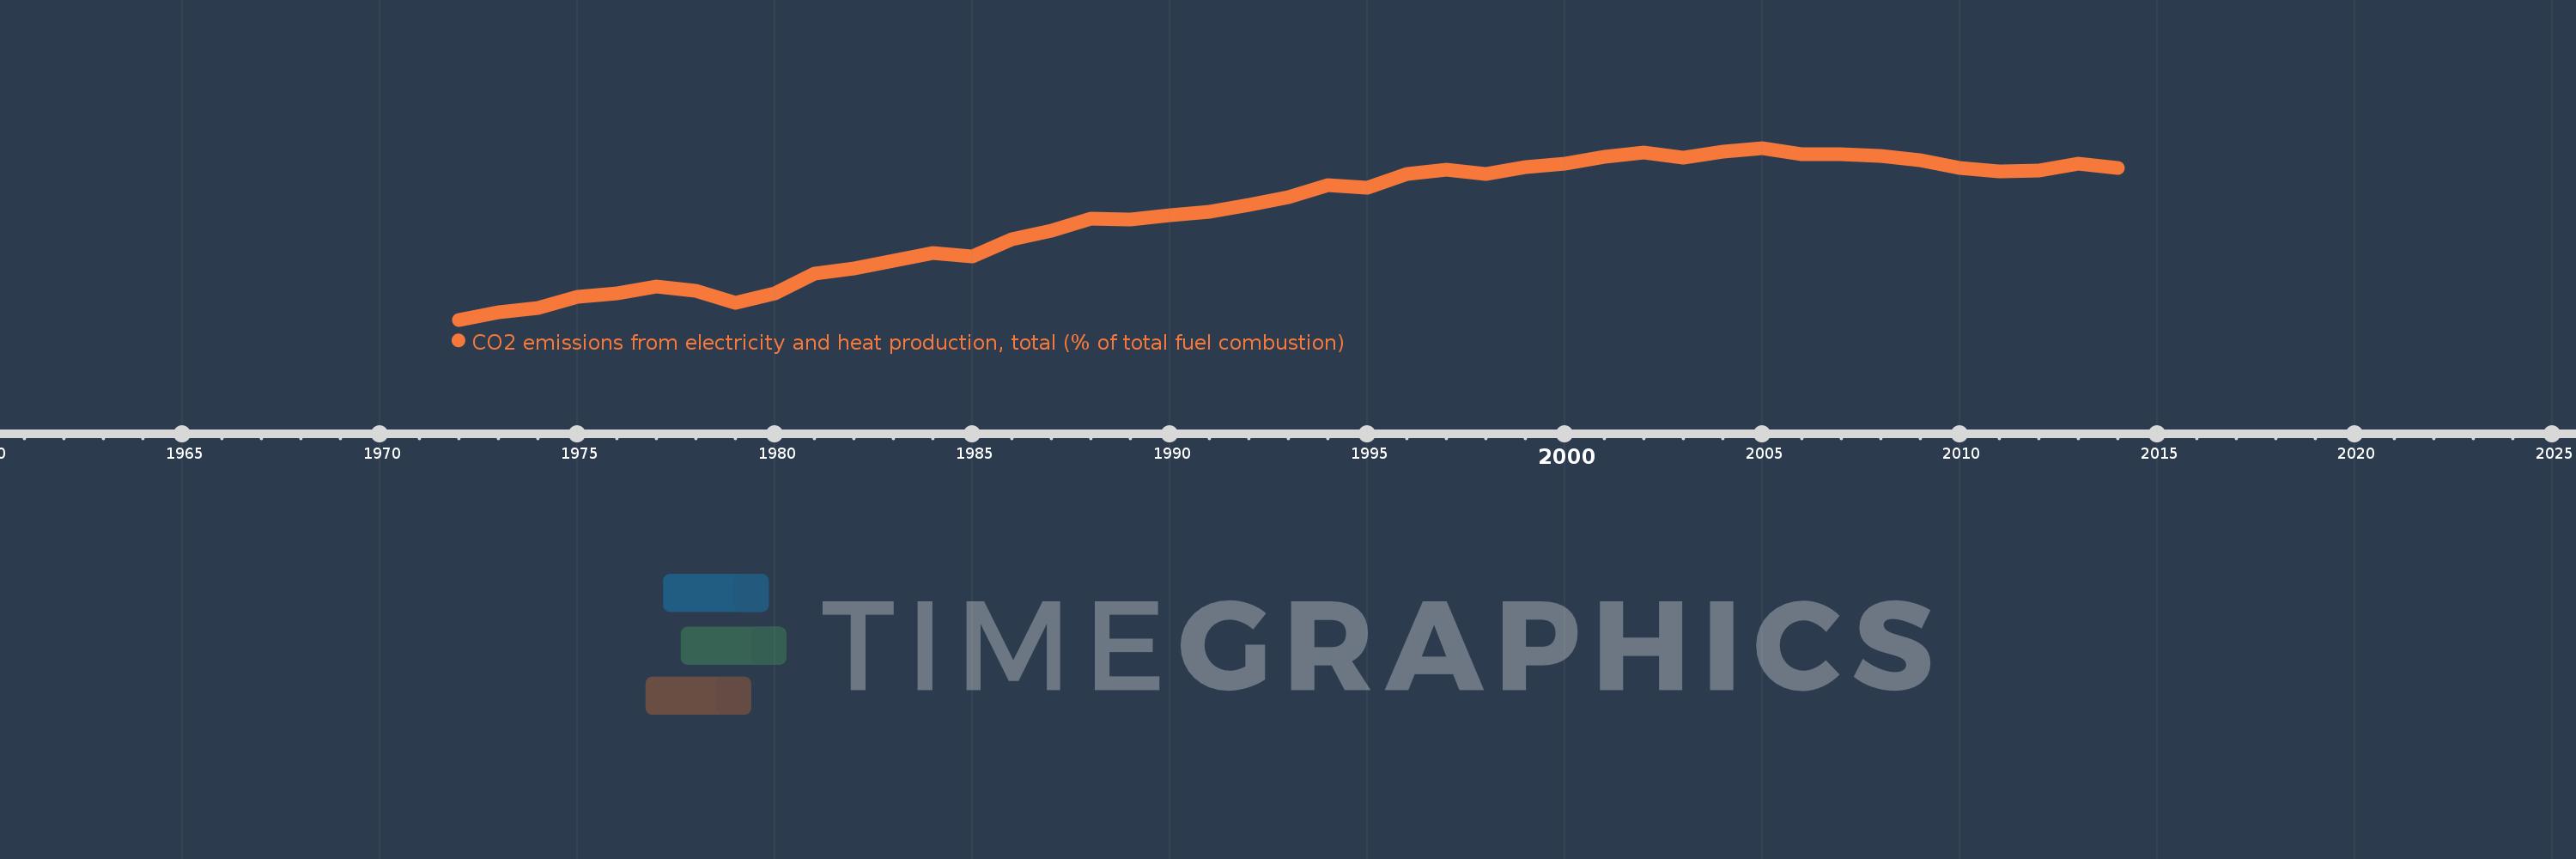
CO2 emissions from electricity and heat production, total (% of total fuel combustion)
2014,2013,2012,2011,2010,2009,2008,2007,2006,2005,2004,2003,2002,2001,2000,1999,1998,1997,1996,1995,1994,1993,1992,1991,1990,1989,1988,1987,1986,1985,1984,1983,1982,1981,1980,1979,1978,1977,1976,1975,1974,1973,1972
This statistics in other country:
AlbaniaAlgeriaAngolaArab WorldArgentinaArmeniaAustraliaAustriaAzerbaijanBahrainBangladeshBelarusBelgiumBeninBoliviaBosnia and HerzegovinaBotswanaBrazilBrunei DarussalamBulgariaCambodiaCameroonCanadaCaribbean small statesCentral Europe and the BalticsChileChinaColombiaCongo, Dem. Rep.Congo, Rep.Costa RicaCote d'IvoireCroatiaCubaCuracaoCyprusCzech RepublicDenmarkDominican RepublicEarly-demographic dividendEast Asia & PacificEast Asia & Pacific (excluding high income)East Asia & Pacific (IDA & IBRD countries)EcuadorEgypt, Arab Rep.El SalvadorEritreaEstoniaEthiopiaEuro areaEurope & Central AsiaEurope & Central Asia (excluding high income)Europe & Central Asia (IDA & IBRD countries)European UnionFinlandFragile and conflict affected situationsFranceGabonGeorgiaGermanyGhanaGibraltarGreeceGuatemalaHaitiHeavily indebted poor countries (HIPC)High incomeHondurasHong Kong SAR, ChinaHungaryIBRD onlyIcelandIDA & IBRD totalIDA blendIDA onlyIDA totalIndiaIndonesiaIran, Islamic Rep.IraqIrelandIsraelItalyJamaicaJapanJordanKazakhstanKenyaKorea, Dem. People’s Rep.Korea, Rep.KosovoKuwaitKyrgyz RepublicLate-demographic dividendLatin America & Caribbean Latin America & Caribbean (excluding high income)Latin America & the Caribbean (IDA & IBRD countries)LatviaLeast developed countries: UN classificationLebanonLibyaLithuaniaLow & middle incomeLow incomeLower middle incomeLuxembourgMacedonia, FYRMalaysiaMaltaMauritiusMexicoMiddle East & North AfricaMiddle East & North Africa (excluding high income)Middle East & North Africa (IDA & IBRD countries)Middle incomeMoldovaMongoliaMontenegroMoroccoMozambiqueMyanmarNamibiaNepalNetherlandsNew ZealandNicaraguaNigerNigeriaNorth AmericaNorwayOECD membersOmanOther small statesPakistanPanamaParaguayPeruPhilippinesPolandPortugalPost-demographic dividendPre-demographic dividendQatarRomaniaRussian FederationSaudi ArabiaSenegalSerbiaSingaporeSlovak RepublicSloveniaSmall statesSouth AfricaSouth AsiaSouth Asia (IDA & IBRD)South SudanSpainSri LankaSub-Saharan Africa Sub-Saharan Africa (excluding high income)Sub-Saharan Africa (IDA & IBRD countries)SudanSwedenSwitzerlandSyrian Arab RepublicTajikistanTanzaniaThailandTogoTrinidad and TobagoTunisiaTurkeyTurkmenistanUkraineUnited Arab EmiratesUnited KingdomUnited StatesUpper middle incomeUruguayUzbekistanVenezuela, RBVietnamWorldYemen, Rep.ZambiaZimbabwe Timeline:
This timeline shows a graph from 1972 to 2014 of India. No data until 1971. Number of actual observations by date: 43.
Source name:
World Development Indicators
Source organization:
IEA Statistics © OECD/IEA 2014 (http://www.iea.org/stats/index.asp), subject to https://www.iea.org/t&c/termsandconditions/
Categories, topics:
Environment
Last updated:
apr 23, 2017
Indicators value changes by year
Minimum:
21.576
jan 1, 1972
Maximum:
57.018
jan 1, 2005
At the date of observation
Value
Absolute change
Change from previous value
jan 1, 1972
21.576
+21.576
0.0%
jan 1, 1973
23.122
+1.546
7.16%
jan 1, 1974
23.927
+0.805
3.48%
jan 1, 1975
26.348
+2.421
10.12%
jan 1, 1976
26.971
+0.623
2.36%
jan 1, 1977
28.465
+1.494
5.54%
jan 1, 1978
27.521
-0.944
-3.32%
jan 1, 1979
25.09
-2.431
-8.83%
jan 1, 1980
27.012
+1.923
7.66%
jan 1, 1981
31.117
+4.104
15.19%
jan 1, 1982
32.183
+1.066
3.42%
jan 1, 1983
33.663
+1.48
4.6%
jan 1, 1984
35.381
+1.719
5.11%
jan 1, 1985
34.584
-0.798
-2.25%
jan 1, 1986
38.205
+3.621
10.47%
jan 1, 1987
39.956
+1.751
4.58%
jan 1, 1988
42.5
+2.544
6.37%
jan 1, 1989
42.255
-0.246
-0.58%
jan 1, 1990
43.171
+0.917
2.17%
jan 1, 1991
43.888
+0.716
1.66%
jan 1, 1992
45.289
+1.401
3.19%
jan 1, 1993
46.936
+1.648
3.64%
jan 1, 1994
49.362
+2.426
5.17%
jan 1, 1995
48.883
-0.48
-0.97%
jan 1, 1996
51.626
+2.743
5.61%
jan 1, 1997
52.602
+0.977
1.89%
jan 1, 1998
51.582
-1.02
-1.94%
jan 1, 1999
53.036
+1.454
2.82%
jan 1, 2000
53.78
+0.743
1.4%
jan 1, 2001
55.262
+1.482
2.76%
jan 1, 2002
56.042
+0.779
1.41%
jan 1, 2003
55.057
-0.984
-1.76%
jan 1, 2004
56.279
+1.221
2.22%
jan 1, 2005
57.018
+0.739
1.31%
jan 1, 2006
55.73
-1.288
-2.26%
jan 1, 2007
55.662
-0.068
-0.12%
jan 1, 2008
55.415
-0.246
-0.44%
jan 1, 2009
54.402
-1.014
-1.83%
jan 1, 2010
52.919
-1.483
-2.73%
jan 1, 2011
52.216
-0.703
-1.33%
jan 1, 2012
52.347
+0.131
0.25%
jan 1, 2013
53.844
+1.497
2.86%
jan 1, 2014
52.856
-0.988
-1.84%
Ranking of countries by current statistics by years


Comments: