29
/
en
AIzaSyAYiBZKx7MnpbEhh9jyipgxe19OcubqV5w
April 1, 2024
29710
Euro area
EMU
false
2
1
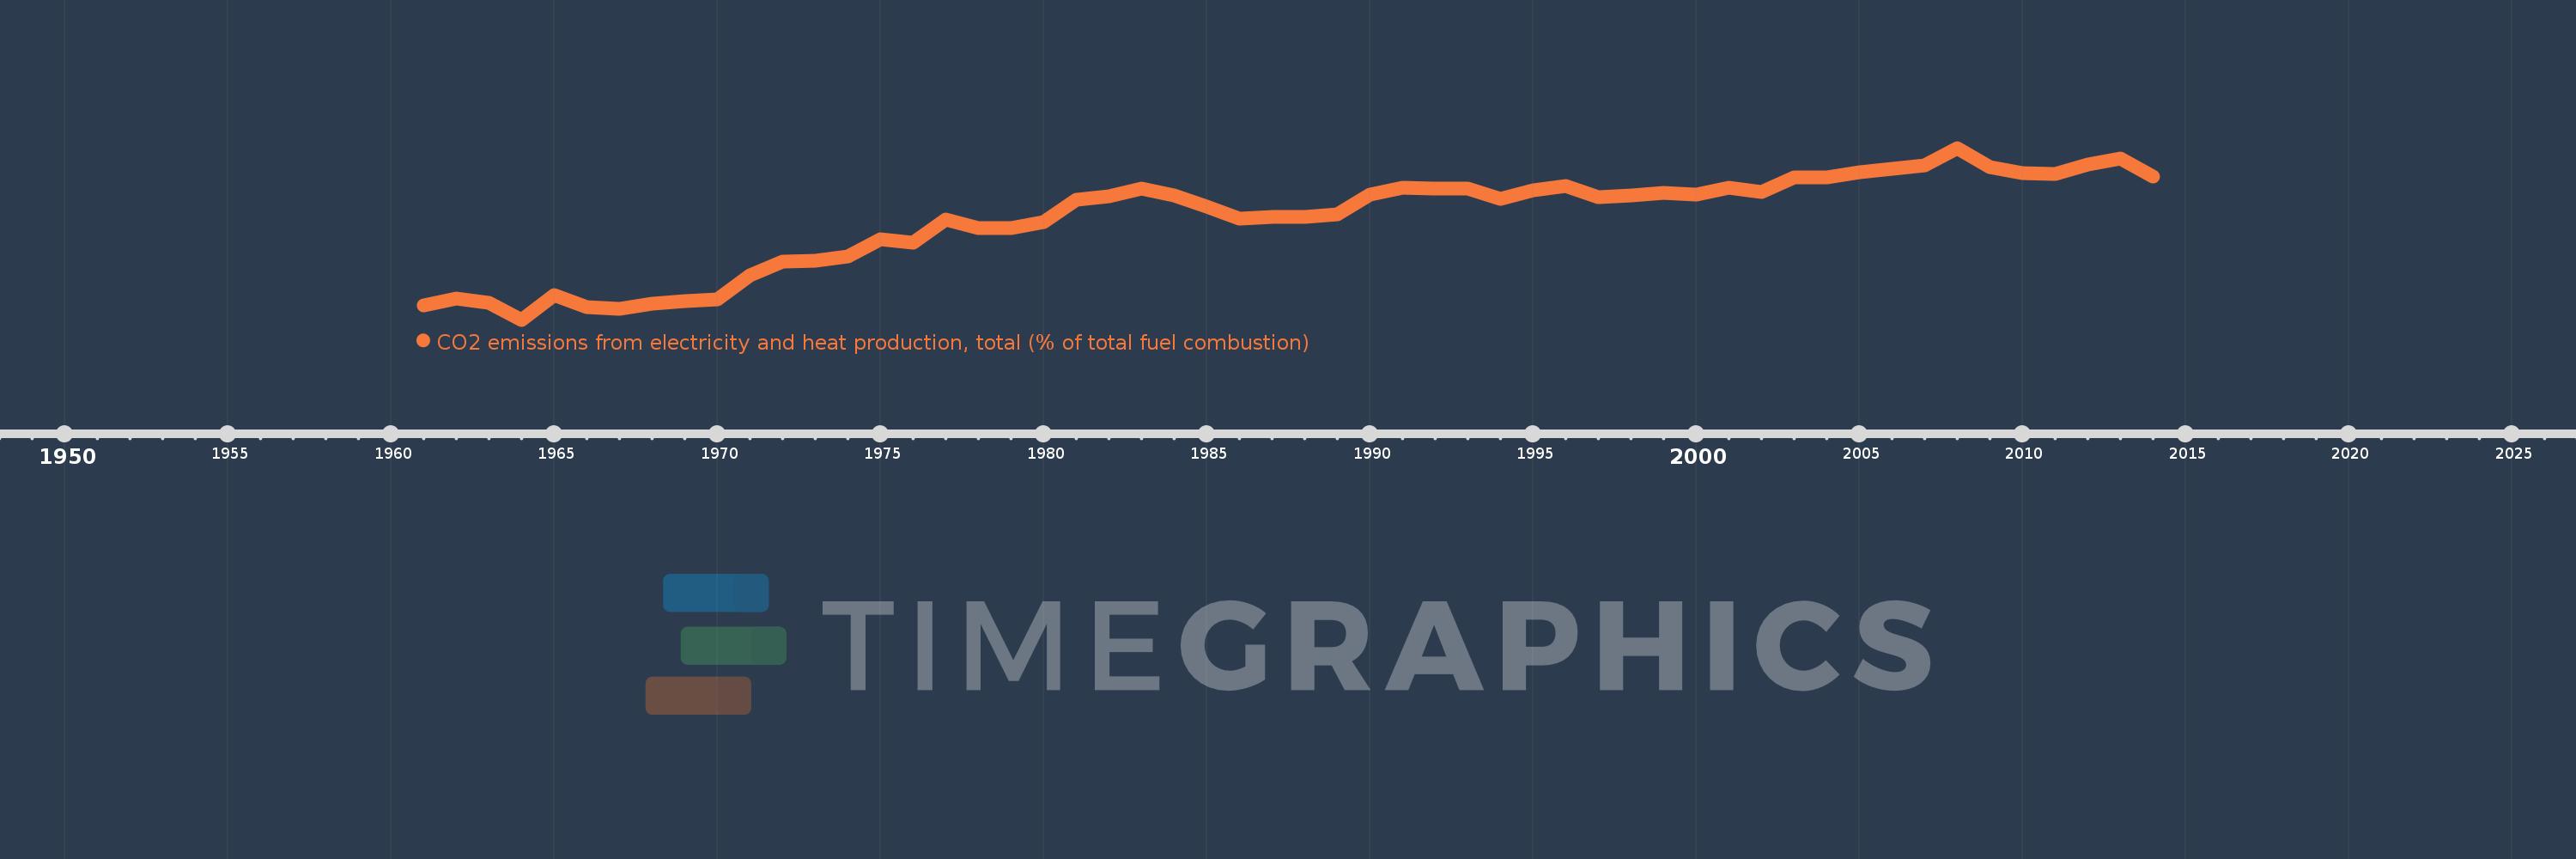
CO2 emissions from electricity and heat production, total (% of total fuel combustion)
2014,2013,2012,2011,2010,2009,2008,2007,2006,2005,2004,2003,2002,2001,2000,1999,1998,1997,1996,1995,1994,1993,1992,1991,1990,1989,1988,1987,1986,1985,1984,1983,1982,1981,1980,1979,1978,1977,1976,1975,1974,1973,1972,1971,1970,1969,1968,1967,1966,1965,1964,1963,1962,1961
This statistics in other country:
AlbaniaAlgeriaAngolaArab WorldArgentinaArmeniaAustraliaAustriaAzerbaijanBahrainBangladeshBelarusBelgiumBeninBoliviaBosnia and HerzegovinaBotswanaBrazilBrunei DarussalamBulgariaCambodiaCameroonCanadaCaribbean small statesCentral Europe and the BalticsChileChinaColombiaCongo, Dem. Rep.Congo, Rep.Costa RicaCote d'IvoireCroatiaCubaCuracaoCyprusCzech RepublicDenmarkDominican RepublicEarly-demographic dividendEast Asia & PacificEast Asia & Pacific (excluding high income)East Asia & Pacific (IDA & IBRD countries)EcuadorEgypt, Arab Rep.El SalvadorEritreaEstoniaEthiopiaEuro areaEurope & Central AsiaEurope & Central Asia (excluding high income)Europe & Central Asia (IDA & IBRD countries)European UnionFinlandFragile and conflict affected situationsFranceGabonGeorgiaGermanyGhanaGibraltarGreeceGuatemalaHaitiHeavily indebted poor countries (HIPC)High incomeHondurasHong Kong SAR, ChinaHungaryIBRD onlyIcelandIDA & IBRD totalIDA blendIDA onlyIDA totalIndiaIndonesiaIran, Islamic Rep.IraqIrelandIsraelItalyJamaicaJapanJordanKazakhstanKenyaKorea, Dem. People’s Rep.Korea, Rep.KosovoKuwaitKyrgyz RepublicLate-demographic dividendLatin America & Caribbean Latin America & Caribbean (excluding high income)Latin America & the Caribbean (IDA & IBRD countries)LatviaLeast developed countries: UN classificationLebanonLibyaLithuaniaLow & middle incomeLow incomeLower middle incomeLuxembourgMacedonia, FYRMalaysiaMaltaMauritiusMexicoMiddle East & North AfricaMiddle East & North Africa (excluding high income)Middle East & North Africa (IDA & IBRD countries)Middle incomeMoldovaMongoliaMontenegroMoroccoMozambiqueMyanmarNamibiaNepalNetherlandsNew ZealandNicaraguaNigerNigeriaNorth AmericaNorwayOECD membersOmanOther small statesPakistanPanamaParaguayPeruPhilippinesPolandPortugalPost-demographic dividendPre-demographic dividendQatarRomaniaRussian FederationSaudi ArabiaSenegalSerbiaSingaporeSlovak RepublicSloveniaSmall statesSouth AfricaSouth AsiaSouth Asia (IDA & IBRD)South SudanSpainSri LankaSub-Saharan Africa Sub-Saharan Africa (excluding high income)Sub-Saharan Africa (IDA & IBRD countries)SudanSwedenSwitzerlandSyrian Arab RepublicTajikistanTanzaniaThailandTogoTrinidad and TobagoTunisiaTurkeyTurkmenistanUkraineUnited Arab EmiratesUnited KingdomUnited StatesUpper middle incomeUruguayUzbekistanVenezuela, RBVietnamWorldYemen, Rep.ZambiaZimbabwe Timeline:
This timeline shows a graph from 1961 to 2014 of Euro area. No data until 1960. Number of actual observations by date: 54.
Source name:
World Development Indicators
Source organization:
IEA Statistics © OECD/IEA 2014 (http://www.iea.org/stats/index.asp), subject to https://www.iea.org/t&c/termsandconditions/
Categories, topics:
Environment
Last updated:
apr 23, 2017
Indicators value changes by year
Minimum:
27.294
jan 1, 1964
Maximum:
41.413
jan 1, 2008
At the date of observation
Value
Absolute change
Change from previous value
jan 1, 1961
28.492
+28.492
0.0%
jan 1, 1962
29.013
+0.52
1.83%
jan 1, 1963
28.695
-0.318
-1.1%
jan 1, 1964
27.294
-1.401
-4.88%
jan 1, 1965
29.337
+2.043
7.49%
jan 1, 1966
28.306
-1.031
-3.52%
jan 1, 1967
28.197
-0.108
-0.38%
jan 1, 1968
28.622
+0.425
1.51%
jan 1, 1969
28.825
+0.202
0.71%
jan 1, 1970
28.934
+0.11
0.38%
jan 1, 1971
30.953
+2.019
6.98%
jan 1, 1972
32.059
+1.106
3.57%
jan 1, 1973
32.16
+0.102
0.32%
jan 1, 1974
32.497
+0.337
1.05%
jan 1, 1975
33.929
+1.432
4.41%
jan 1, 1976
33.605
-0.324
-0.95%
jan 1, 1977
35.535
+1.93
5.74%
jan 1, 1978
34.815
-0.721
-2.03%
jan 1, 1979
34.82
+0.005
0.02%
jan 1, 1980
35.288
+0.468
1.34%
jan 1, 1981
37.17
+1.882
5.33%
jan 1, 1982
37.472
+0.302
0.81%
jan 1, 1983
38.068
+0.597
1.59%
jan 1, 1984
37.527
-0.541
-1.42%
jan 1, 1985
36.59
-0.938
-2.5%
jan 1, 1986
35.601
-0.989
-2.7%
jan 1, 1987
35.719
+0.119
0.33%
jan 1, 1988
35.731
+0.012
0.03%
jan 1, 1989
35.946
+0.215
0.6%
jan 1, 1990
37.567
+1.621
4.51%
jan 1, 1991
38.148
+0.58
1.54%
jan 1, 1992
38.042
-0.106
-0.28%
jan 1, 1993
38.045
+0.003
0.01%
jan 1, 1994
37.224
-0.821
-2.16%
jan 1, 1995
37.899
+0.674
1.81%
jan 1, 1996
38.258
+0.36
0.95%
jan 1, 1997
37.378
-0.88
-2.3%
jan 1, 1998
37.51
+0.132
0.35%
jan 1, 1999
37.694
+0.184
0.49%
jan 1, 2000
37.599
-0.094
-0.25%
jan 1, 2001
38.117
+0.518
1.38%
jan 1, 2002
37.769
-0.348
-0.91%
jan 1, 2003
39.026
+1.256
3.33%
jan 1, 2004
38.988
-0.037
-0.1%
jan 1, 2005
39.41
+0.421
1.08%
jan 1, 2006
39.707
+0.297
0.75%
jan 1, 2007
40.012
+0.305
0.77%
jan 1, 2008
41.413
+1.401
3.5%
jan 1, 2009
39.831
-1.582
-3.82%
jan 1, 2010
39.325
-0.507
-1.27%
jan 1, 2011
39.301
-0.023
-0.06%
jan 1, 2012
40.039
+0.738
1.88%
jan 1, 2013
40.517
+0.478
1.19%
jan 1, 2014
39.049
-1.467
-3.62%
Ranking of countries by current statistics by years


Comments: