29
/
en
AIzaSyAYiBZKx7MnpbEhh9jyipgxe19OcubqV5w
April 1, 2024
43990
Latin America & the Caribbean (IDA & IBRD countries)
TLA
false
2
1
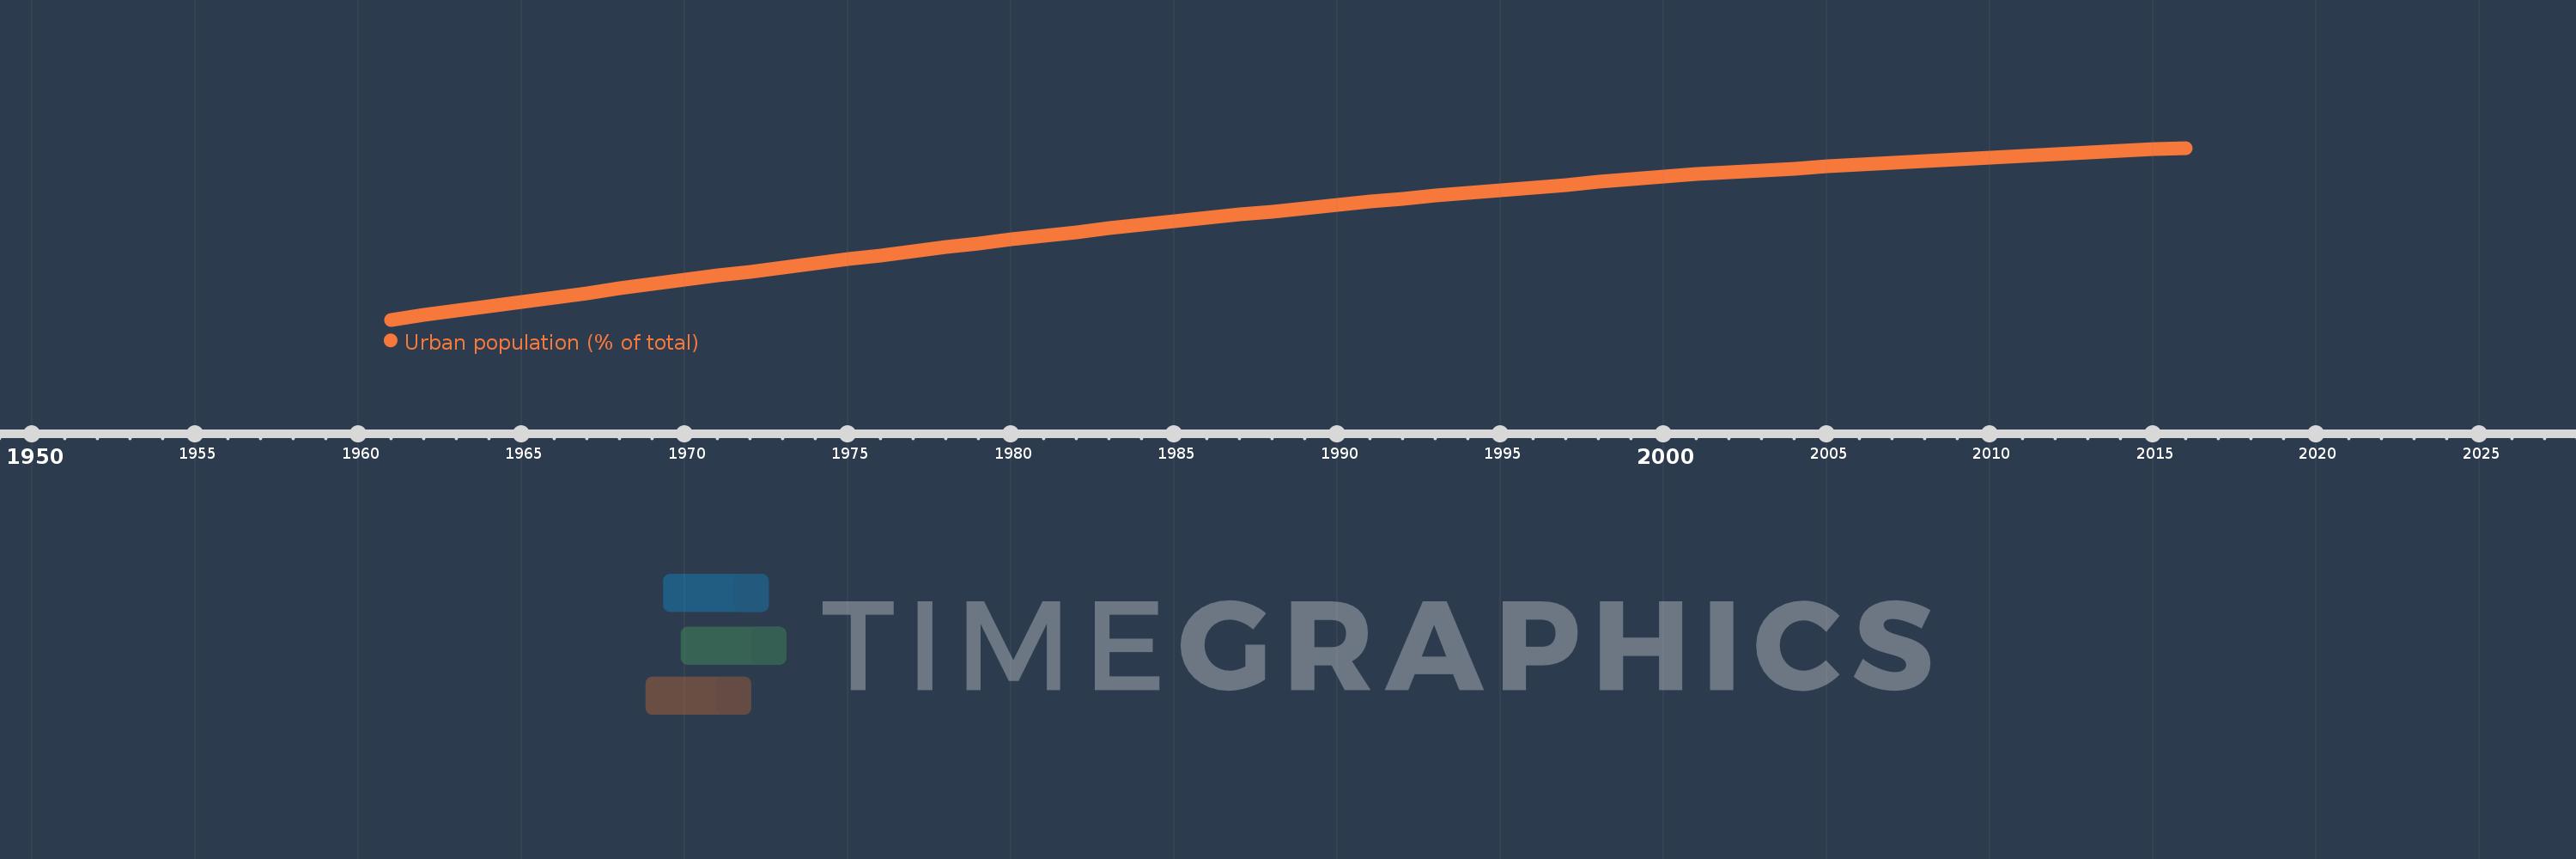
Urban population (% of total)
2016,2015,2014,2013,2012,2011,2010,2009,2008,2007,2006,2005,2004,2003,2002,2001,2000,1999,1998,1997,1996,1995,1994,1993,1992,1991,1990,1989,1988,1987,1986,1985,1984,1983,1982,1981,1980,1979,1978,1977,1976,1975,1974,1973,1972,1971,1970,1969,1968,1967,1966,1965,1964,1963,1962,1961
This statistics in other country:
AfghanistanAlbaniaAlgeriaAmerican SamoaAndorraAngolaAntigua and BarbudaArab WorldArgentinaArmeniaArubaAustraliaAustriaAzerbaijanBahamas, TheBahrainBangladeshBarbadosBelarusBelgiumBelizeBeninBermudaBhutanBoliviaBosnia and HerzegovinaBotswanaBrazilBritish Virgin IslandsBrunei DarussalamBulgariaBurkina FasoBurundiCabo VerdeCambodiaCameroonCanadaCaribbean small statesCayman IslandsCentral African RepublicCentral Europe and the BalticsChadChannel IslandsChileChinaColombiaComorosCongo, Dem. Rep.Congo, Rep.Costa RicaCote d'IvoireCroatiaCubaCuracaoCyprusCzech RepublicDenmarkDjiboutiDominicaDominican RepublicEarly-demographic dividendEast Asia & PacificEast Asia & Pacific (excluding high income)East Asia & Pacific (IDA & IBRD countries)EcuadorEgypt, Arab Rep.El SalvadorEquatorial GuineaEritreaEstoniaEthiopiaEuro areaEurope & Central AsiaEurope & Central Asia (excluding high income)Europe & Central Asia (IDA & IBRD countries)European UnionFaroe IslandsFijiFinlandFragile and conflict affected situationsFranceFrench PolynesiaGabonGambia, TheGeorgiaGermanyGhanaGibraltarGreeceGreenlandGrenadaGuamGuatemalaGuineaGuinea-BissauGuyanaHaitiHeavily indebted poor countries (HIPC)High incomeHondurasHong Kong SAR, ChinaHungaryIBRD onlyIcelandIDA & IBRD totalIDA blendIDA onlyIDA totalIndiaIndonesiaIran, Islamic Rep.IraqIrelandIsle of ManIsraelItalyJamaicaJapanJordanKazakhstanKenyaKiribatiKorea, Dem. People’s Rep.Korea, Rep.KuwaitKyrgyz RepublicLao PDRLate-demographic dividendLatin America & Caribbean Latin America & Caribbean (excluding high income)Latin America & the Caribbean (IDA & IBRD countries)LatviaLeast developed countries: UN classificationLebanonLesothoLiberiaLibyaLiechtensteinLithuaniaLow & middle incomeLow incomeLower middle incomeLuxembourgMacao SAR, ChinaMacedonia, FYRMadagascarMalawiMalaysiaMaldivesMaliMaltaMarshall IslandsMauritaniaMauritiusMexicoMicronesia, Fed. Sts.Middle East & North AfricaMiddle East & North Africa (excluding high income)Middle East & North Africa (IDA & IBRD countries)Middle incomeMoldovaMonacoMongoliaMontenegroMoroccoMozambiqueMyanmarNamibiaNauruNepalNetherlandsNew CaledoniaNew ZealandNicaraguaNigerNigeriaNorth AmericaNorthern Mariana IslandsNorwayOECD membersOmanOther small statesPacific island small statesPakistanPalauPanamaPapua New GuineaParaguayPeruPhilippinesPolandPortugalPost-demographic dividendPre-demographic dividendPuerto RicoQatarRomaniaRussian FederationRwandaSamoaSan MarinoSao Tome and PrincipeSaudi ArabiaSenegalSerbiaSeychellesSierra LeoneSingaporeSint Maarten (Dutch part)Slovak RepublicSloveniaSmall statesSolomon IslandsSomaliaSouth AfricaSouth AsiaSouth Asia (IDA & IBRD)South SudanSpainSri LankaSt. Kitts and NevisSt. LuciaSt. Vincent and the GrenadinesSub-Saharan Africa Sub-Saharan Africa (excluding high income)Sub-Saharan Africa (IDA & IBRD countries)SudanSurinameSwazilandSwedenSwitzerlandSyrian Arab RepublicTajikistanTanzaniaThailandTimor-LesteTogoTongaTrinidad and TobagoTunisiaTurkeyTurkmenistanTurks and Caicos IslandsTuvaluUgandaUkraineUnited Arab EmiratesUnited KingdomUnited StatesUpper middle incomeUruguayUzbekistanVanuatuVenezuela, RBVietnamVirgin Islands (U.S.)West Bank and GazaWorldYemen, Rep.ZambiaZimbabwe Timeline:
This timeline shows a graph from 1961 to 2016 of Latin America & the Caribbean (IDA & IBRD countries). No data until 1960. Number of actual observations by date: 56.
Source name:
World Development Indicators
Source organization:
United Nations, World Urbanization Prospects.
Categories, topics:
Climate Change, Urban Development
Last updated:
apr 23, 2017
Indicators value changes by year
Minimum:
49.018
jan 1, 1961
Maximum:
79.875
jan 1, 2016
At the date of observation
Value
Absolute change
Change from previous value
jan 1, 1961
49.018
+49.018
0.0%
jan 1, 1962
49.823
+0.805
1.64%
jan 1, 1963
50.639
+0.815
1.64%
jan 1, 1964
51.457
+0.818
1.62%
jan 1, 1965
52.28
+0.824
1.6%
jan 1, 1966
53.056
+0.775
1.48%
jan 1, 1967
53.831
+0.775
1.46%
jan 1, 1968
54.606
+0.775
1.44%
jan 1, 1969
55.381
+0.776
1.42%
jan 1, 1970
56.153
+0.772
1.39%
jan 1, 1971
56.921
+0.767
1.37%
jan 1, 1972
57.681
+0.761
1.34%
jan 1, 1973
58.431
+0.75
1.3%
jan 1, 1974
59.156
+0.725
1.24%
jan 1, 1975
59.872
+0.716
1.21%
jan 1, 1976
60.589
+0.716
1.2%
jan 1, 1977
61.301
+0.712
1.18%
jan 1, 1978
62.013
+0.712
1.16%
jan 1, 1979
62.722
+0.709
1.14%
jan 1, 1980
63.424
+0.702
1.12%
jan 1, 1981
64.118
+0.694
1.09%
jan 1, 1982
64.776
+0.658
1.03%
jan 1, 1983
65.413
+0.636
0.98%
jan 1, 1984
66.035
+0.623
0.95%
jan 1, 1985
66.655
+0.619
0.94%
jan 1, 1986
67.271
+0.616
0.92%
jan 1, 1987
67.876
+0.605
0.9%
jan 1, 1988
68.473
+0.596
0.88%
jan 1, 1989
69.063
+0.591
0.86%
jan 1, 1990
69.643
+0.58
0.84%
jan 1, 1991
70.21
+0.567
0.81%
jan 1, 1992
70.753
+0.543
0.77%
jan 1, 1993
71.277
+0.523
0.74%
jan 1, 1994
71.787
+0.51
0.72%
jan 1, 1995
72.293
+0.505
0.7%
jan 1, 1996
72.789
+0.496
0.69%
jan 1, 1997
73.261
+0.472
0.65%
jan 1, 1998
73.742
+0.481
0.66%
jan 1, 1999
74.217
+0.476
0.64%
jan 1, 2000
74.678
+0.461
0.62%
jan 1, 2001
75.137
+0.458
0.61%
jan 1, 2002
75.504
+0.368
0.49%
jan 1, 2003
75.849
+0.344
0.46%
jan 1, 2004
76.187
+0.338
0.45%
jan 1, 2005
76.524
+0.337
0.44%
jan 1, 2006
76.854
+0.331
0.43%
jan 1, 2007
77.18
+0.326
0.42%
jan 1, 2008
77.5
+0.32
0.41%
jan 1, 2009
77.816
+0.316
0.41%
jan 1, 2010
78.126
+0.31
0.4%
jan 1, 2011
78.432
+0.306
0.39%
jan 1, 2012
78.734
+0.302
0.39%
jan 1, 2013
79.03
+0.295
0.38%
jan 1, 2014
79.318
+0.289
0.37%
jan 1, 2015
79.6
+0.282
0.36%
jan 1, 2016
79.875
+0.275
0.35%
Ranking of countries by current statistics by years


Comments: