29
/
en
AIzaSyAYiBZKx7MnpbEhh9jyipgxe19OcubqV5w
April 1, 2024
81399
Belarus
BLR
true
2
1
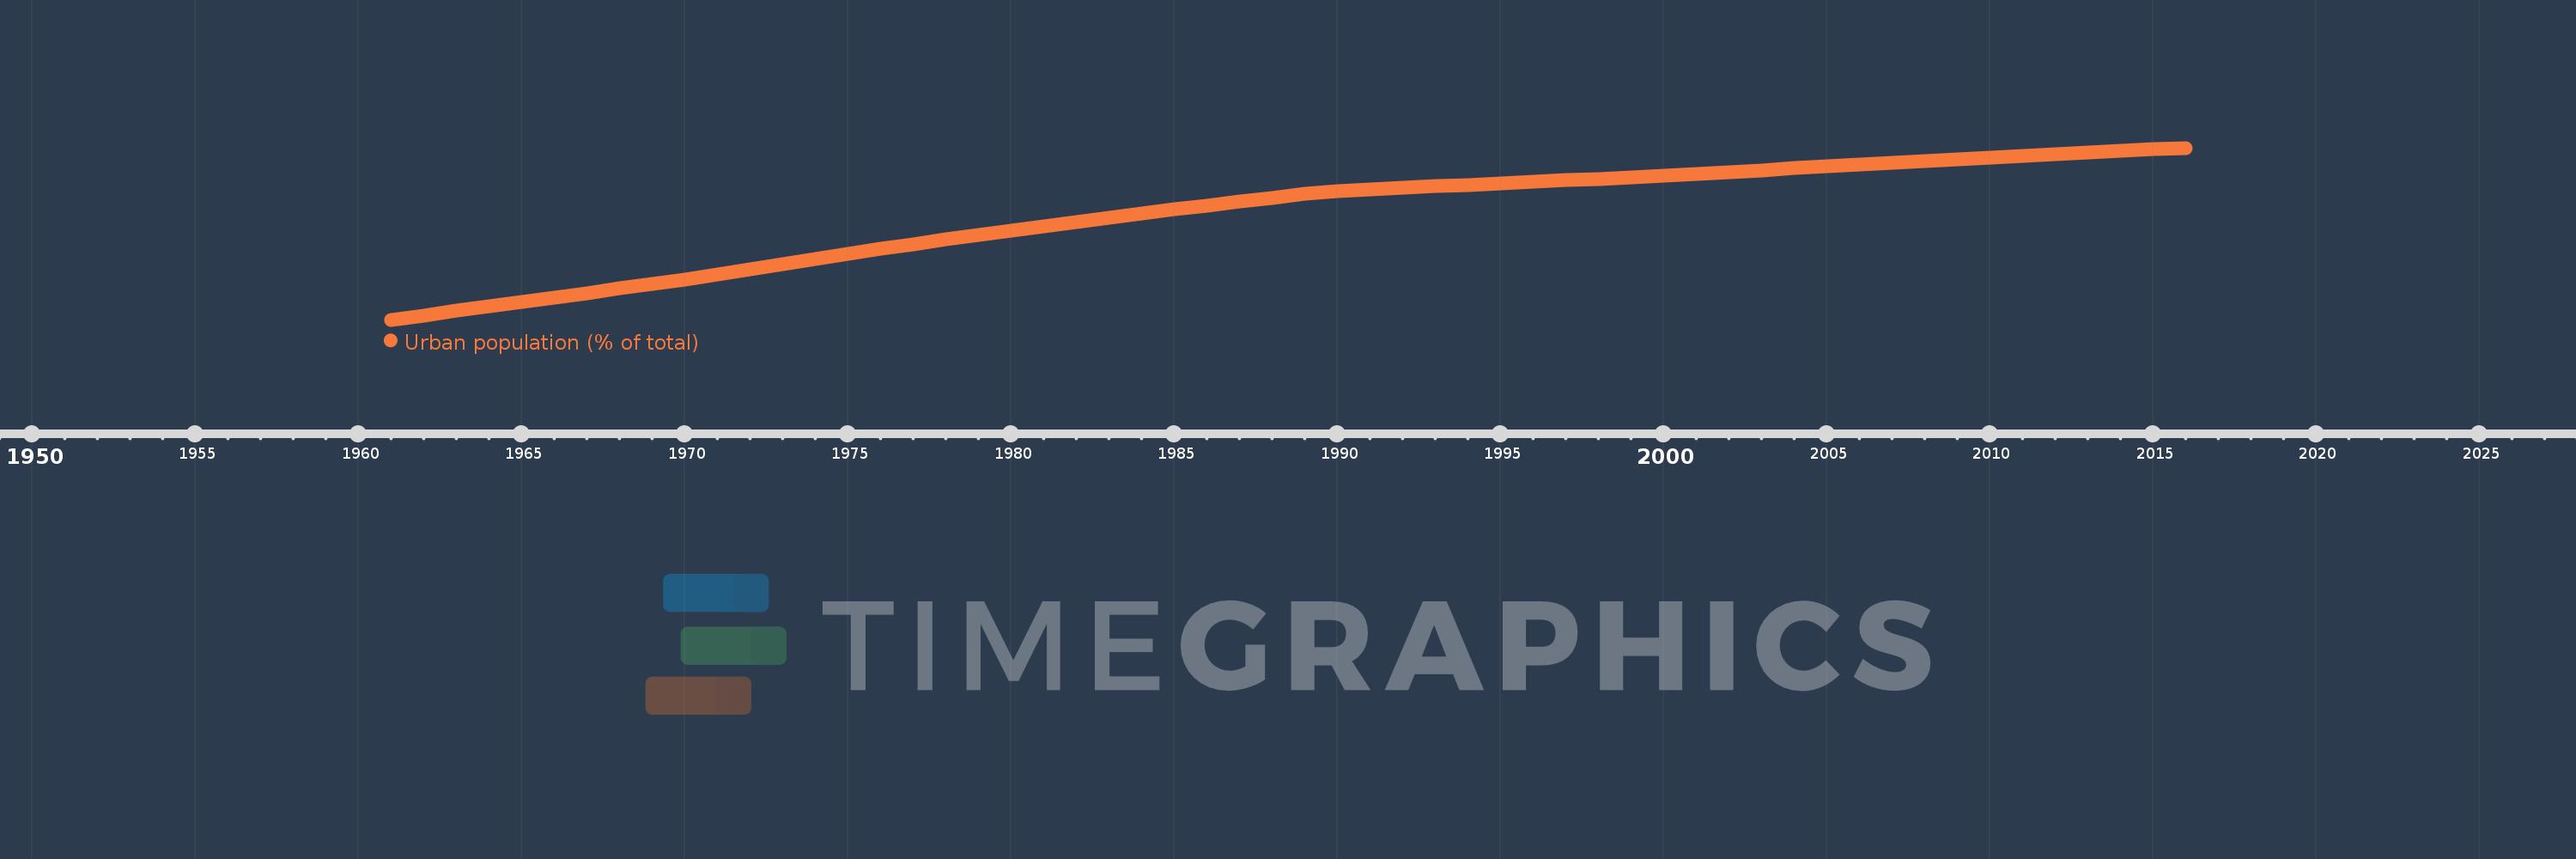
Urban population (% of total)
2016,2015,2014,2013,2012,2011,2010,2009,2008,2007,2006,2005,2004,2003,2002,2001,2000,1999,1998,1997,1996,1995,1994,1993,1992,1991,1990,1989,1988,1987,1986,1985,1984,1983,1982,1981,1980,1979,1978,1977,1976,1975,1974,1973,1972,1971,1970,1969,1968,1967,1966,1965,1964,1963,1962,1961
This statistics in other country:
AfghanistanAlbaniaAlgeriaAmerican SamoaAndorraAngolaAntigua and BarbudaArab WorldArgentinaArmeniaArubaAustraliaAustriaAzerbaijanBahamas, TheBahrainBangladeshBarbadosBelarusBelgiumBelizeBeninBermudaBhutanBoliviaBosnia and HerzegovinaBotswanaBrazilBritish Virgin IslandsBrunei DarussalamBulgariaBurkina FasoBurundiCabo VerdeCambodiaCameroonCanadaCaribbean small statesCayman IslandsCentral African RepublicCentral Europe and the BalticsChadChannel IslandsChileChinaColombiaComorosCongo, Dem. Rep.Congo, Rep.Costa RicaCote d'IvoireCroatiaCubaCuracaoCyprusCzech RepublicDenmarkDjiboutiDominicaDominican RepublicEarly-demographic dividendEast Asia & PacificEast Asia & Pacific (excluding high income)East Asia & Pacific (IDA & IBRD countries)EcuadorEgypt, Arab Rep.El SalvadorEquatorial GuineaEritreaEstoniaEthiopiaEuro areaEurope & Central AsiaEurope & Central Asia (excluding high income)Europe & Central Asia (IDA & IBRD countries)European UnionFaroe IslandsFijiFinlandFragile and conflict affected situationsFranceFrench PolynesiaGabonGambia, TheGeorgiaGermanyGhanaGibraltarGreeceGreenlandGrenadaGuamGuatemalaGuineaGuinea-BissauGuyanaHaitiHeavily indebted poor countries (HIPC)High incomeHondurasHong Kong SAR, ChinaHungaryIBRD onlyIcelandIDA & IBRD totalIDA blendIDA onlyIDA totalIndiaIndonesiaIran, Islamic Rep.IraqIrelandIsle of ManIsraelItalyJamaicaJapanJordanKazakhstanKenyaKiribatiKorea, Dem. People’s Rep.Korea, Rep.KuwaitKyrgyz RepublicLao PDRLate-demographic dividendLatin America & Caribbean Latin America & Caribbean (excluding high income)Latin America & the Caribbean (IDA & IBRD countries)LatviaLeast developed countries: UN classificationLebanonLesothoLiberiaLibyaLiechtensteinLithuaniaLow & middle incomeLow incomeLower middle incomeLuxembourgMacao SAR, ChinaMacedonia, FYRMadagascarMalawiMalaysiaMaldivesMaliMaltaMarshall IslandsMauritaniaMauritiusMexicoMicronesia, Fed. Sts.Middle East & North AfricaMiddle East & North Africa (excluding high income)Middle East & North Africa (IDA & IBRD countries)Middle incomeMoldovaMonacoMongoliaMontenegroMoroccoMozambiqueMyanmarNamibiaNauruNepalNetherlandsNew CaledoniaNew ZealandNicaraguaNigerNigeriaNorth AmericaNorthern Mariana IslandsNorwayOECD membersOmanOther small statesPacific island small statesPakistanPalauPanamaPapua New GuineaParaguayPeruPhilippinesPolandPortugalPost-demographic dividendPre-demographic dividendPuerto RicoQatarRomaniaRussian FederationRwandaSamoaSan MarinoSao Tome and PrincipeSaudi ArabiaSenegalSerbiaSeychellesSierra LeoneSingaporeSint Maarten (Dutch part)Slovak RepublicSloveniaSmall statesSolomon IslandsSomaliaSouth AfricaSouth AsiaSouth Asia (IDA & IBRD)South SudanSpainSri LankaSt. Kitts and NevisSt. LuciaSt. Vincent and the GrenadinesSub-Saharan Africa Sub-Saharan Africa (excluding high income)Sub-Saharan Africa (IDA & IBRD countries)SudanSurinameSwazilandSwedenSwitzerlandSyrian Arab RepublicTajikistanTanzaniaThailandTimor-LesteTogoTongaTrinidad and TobagoTunisiaTurkeyTurkmenistanTurks and Caicos IslandsTuvaluUgandaUkraineUnited Arab EmiratesUnited KingdomUnited StatesUpper middle incomeUruguayUzbekistanVanuatuVenezuela, RBVietnamVirgin Islands (U.S.)West Bank and GazaWorldYemen, Rep.ZambiaZimbabwe Timeline:
This timeline shows a graph from 1961 to 2016 of Belarus. No data until 1960. Number of actual observations by date: 56.
Source name:
World Development Indicators
Source organization:
United Nations, World Urbanization Prospects.
Categories, topics:
Climate Change, Urban Development
Last updated:
apr 23, 2017
Indicators value changes by year
Minimum:
32.401
jan 1, 1961
Maximum:
76.667
jan 1, 2016
At the date of observation
Value
Absolute change
Change from previous value
jan 1, 1961
32.401
+32.401
0.0%
jan 1, 1962
33.522
+1.121
3.46%
jan 1, 1963
34.663
+1.141
3.4%
jan 1, 1964
35.822
+1.159
3.34%
jan 1, 1965
37.0
+1.178
3.29%
jan 1, 1966
38.127
+1.127
3.05%
jan 1, 1967
39.269
+1.142
3.0%
jan 1, 1968
40.422
+1.153
2.94%
jan 1, 1969
41.588
+1.166
2.88%
jan 1, 1970
42.76
+1.172
2.82%
jan 1, 1971
44.01
+1.25
2.92%
jan 1, 1972
45.349
+1.339
3.04%
jan 1, 1973
46.697
+1.348
2.97%
jan 1, 1974
48.046
+1.349
2.89%
jan 1, 1975
49.4
+1.354
2.82%
jan 1, 1976
50.614
+1.214
2.46%
jan 1, 1977
51.829
+1.215
2.4%
jan 1, 1978
53.039
+1.21
2.33%
jan 1, 1979
54.247
+1.208
2.28%
jan 1, 1980
55.402
+1.155
2.13%
jan 1, 1981
56.498
+1.096
1.98%
jan 1, 1982
57.584
+1.086
1.92%
jan 1, 1983
58.664
+1.08
1.88%
jan 1, 1984
59.736
+1.072
1.83%
jan 1, 1985
60.8
+1.064
1.78%
jan 1, 1986
61.833
+1.033
1.7%
jan 1, 1987
62.857
+1.024
1.66%
jan 1, 1988
63.87
+1.013
1.61%
jan 1, 1989
64.872
+1.002
1.57%
jan 1, 1990
65.585
+0.713
1.1%
jan 1, 1991
65.981
+0.396
0.6%
jan 1, 1992
66.374
+0.393
0.6%
jan 1, 1993
66.766
+0.392
0.59%
jan 1, 1994
67.155
+0.389
0.58%
jan 1, 1995
67.541
+0.386
0.57%
jan 1, 1996
67.926
+0.385
0.57%
jan 1, 1997
68.308
+0.382
0.56%
jan 1, 1998
68.687
+0.379
0.55%
jan 1, 1999
69.064
+0.377
0.55%
jan 1, 2000
69.482
+0.418
0.61%
jan 1, 2001
69.973
+0.491
0.71%
jan 1, 2002
70.458
+0.485
0.69%
jan 1, 2003
70.939
+0.481
0.68%
jan 1, 2004
71.415
+0.476
0.67%
jan 1, 2005
71.887
+0.472
0.66%
jan 1, 2006
72.354
+0.467
0.65%
jan 1, 2007
72.816
+0.462
0.64%
jan 1, 2008
73.273
+0.457
0.63%
jan 1, 2009
73.726
+0.453
0.62%
jan 1, 2010
74.172
+0.446
0.6%
jan 1, 2011
74.615
+0.443
0.6%
jan 1, 2012
75.046
+0.431
0.58%
jan 1, 2013
75.467
+0.421
0.56%
jan 1, 2014
75.877
+0.41
0.54%
jan 1, 2015
76.277
+0.4
0.53%
jan 1, 2016
76.667
+0.39
0.51%
Ranking of countries by current statistics by years


Comments: